Factory Analytics ✨
This module allows access to advanced analytical data and useful tools for making management decisions. In combination with the additional Industrial Accounting🔥 functionality, it is also possible to view economic data, that is, to analyze the overall industrial value of production and its profitability.
Production Orders
Main View
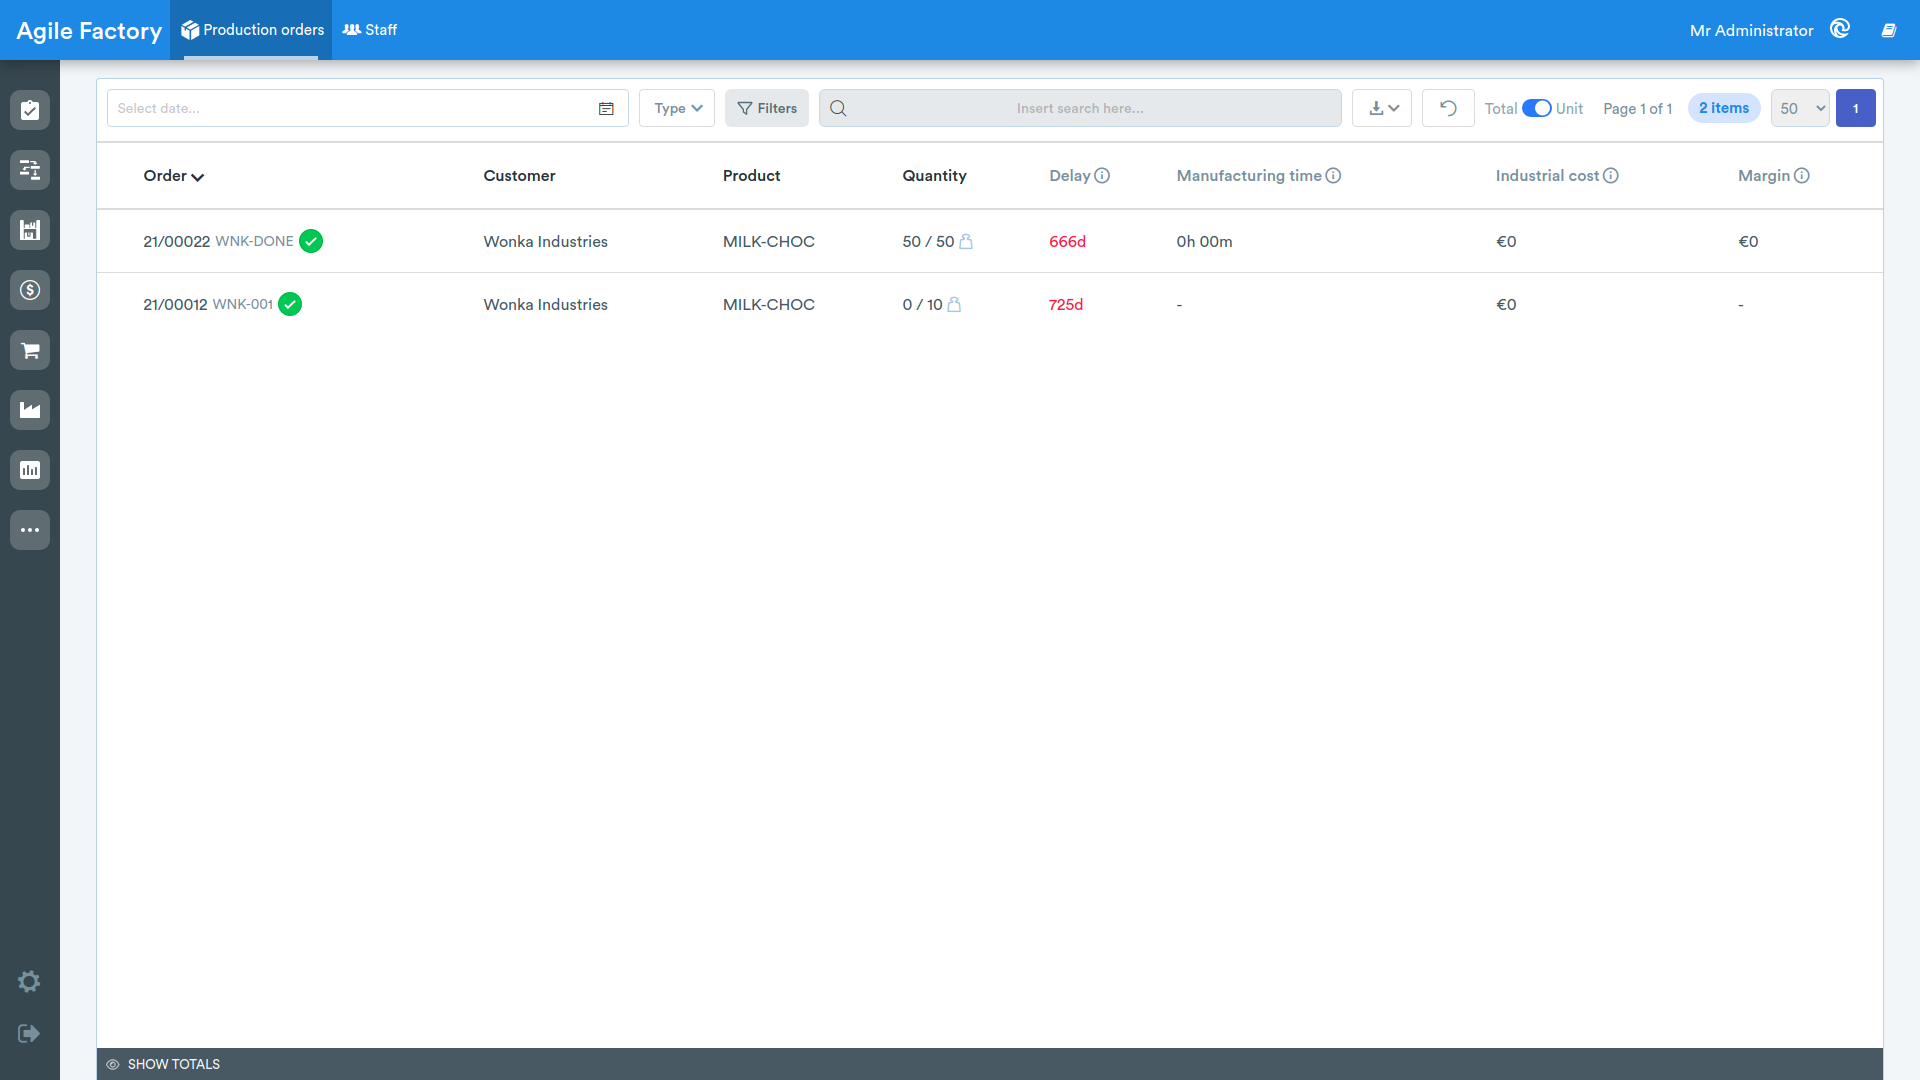
This section contains analytical data and tools related to completed production orders. The main view consists of a list of production orders with the following columns:
- Order: production order name (next to the order name, the customer order name is displayed).
- Customer: customer name.
- Item: product name.
- Quantity: quantity produced / expected quantity.
- Delay: in red - delay, in green - early compared to the expected delivery date in days.
- Production time: actual production time.
- Industrial cost: total industrial cost.
- Margin: revenue from sale taking into account production cost.
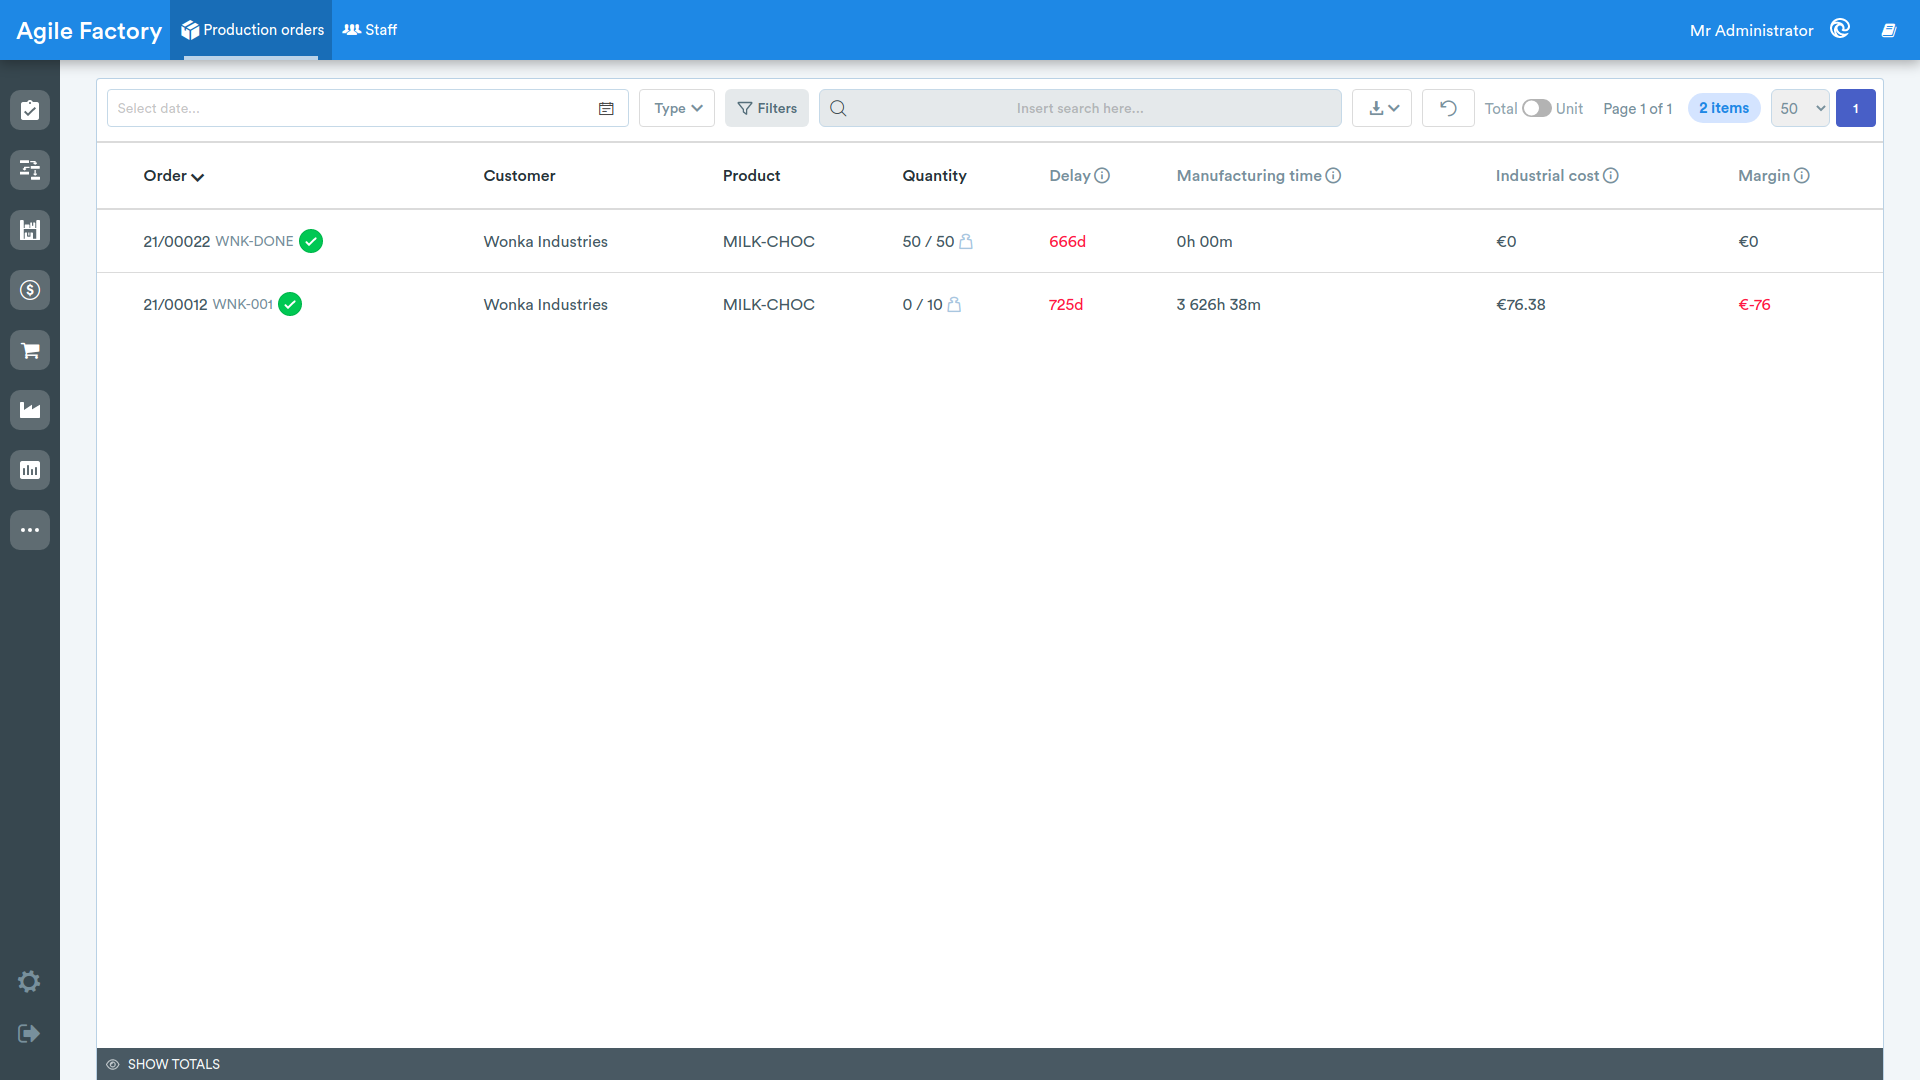
Above the tabular data, various filters are available that allow the user to find the necessary information.
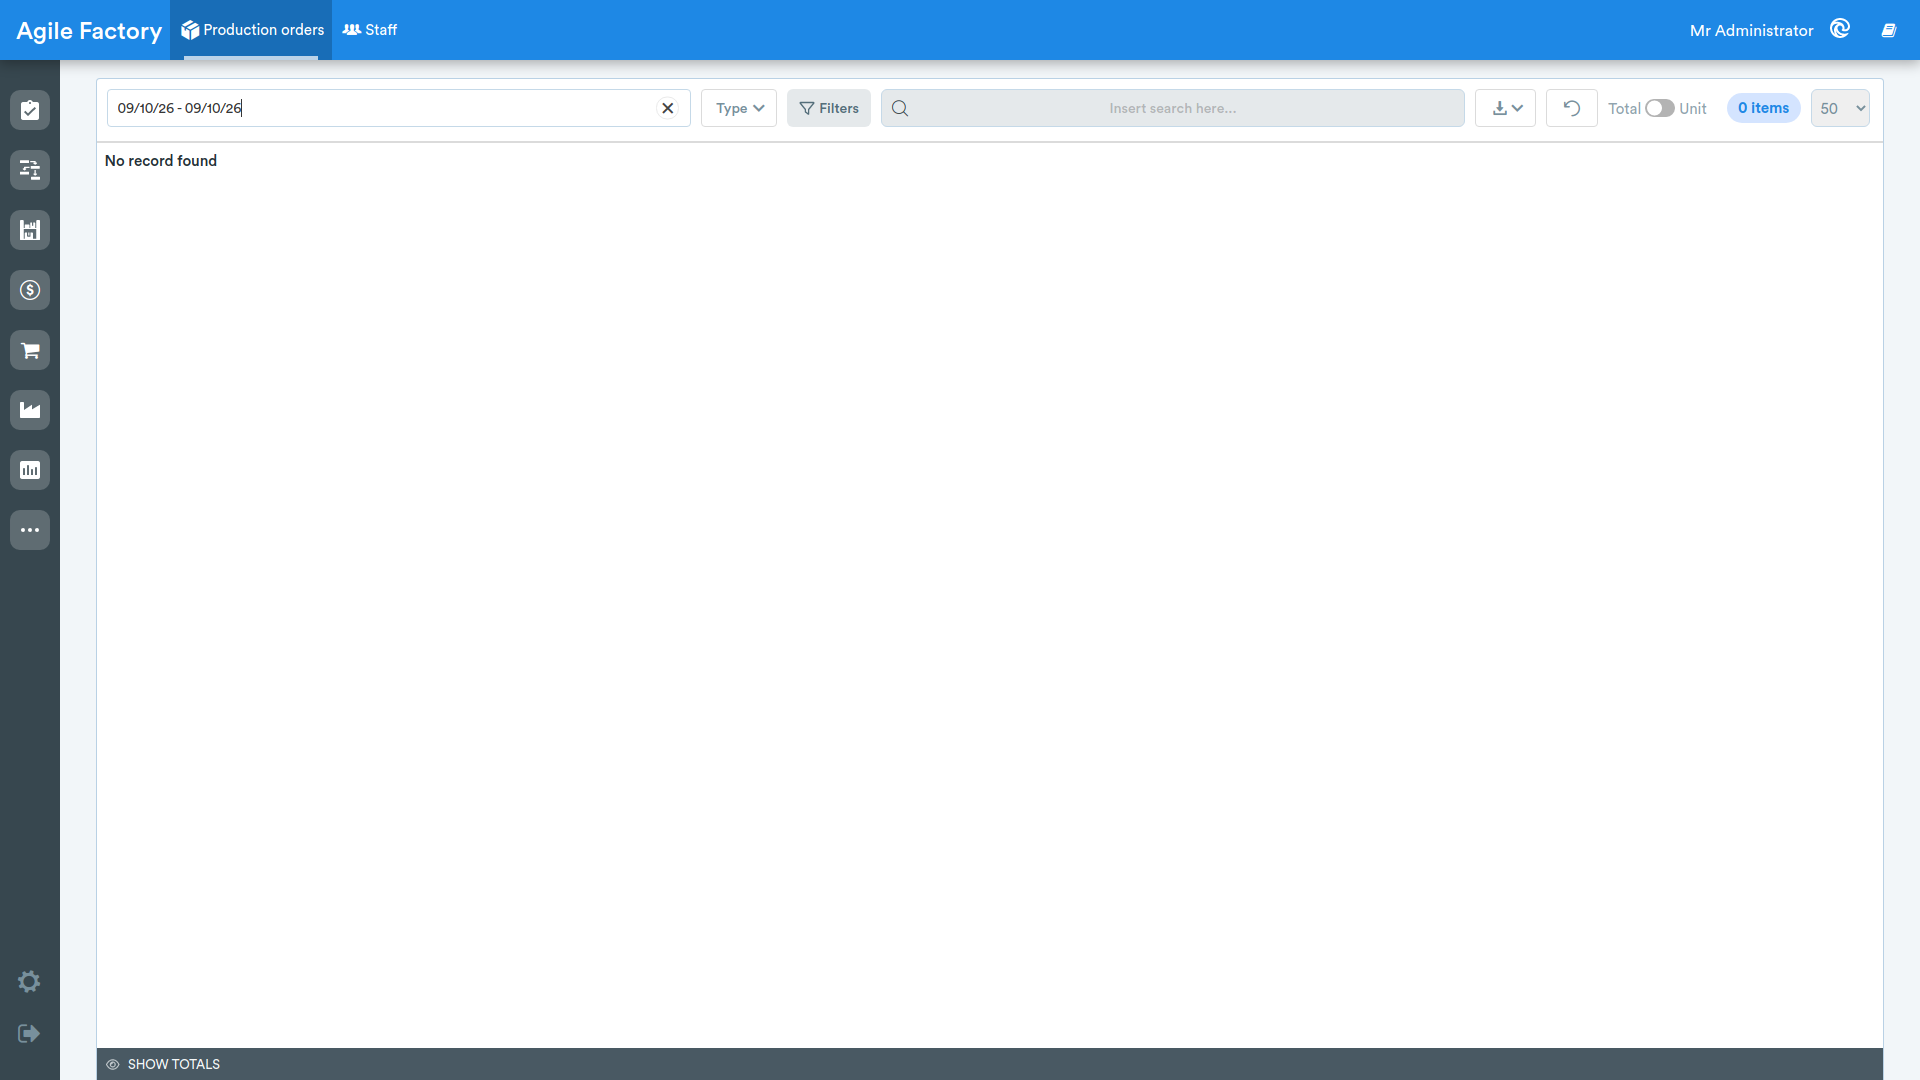
- by dates: it is possible to select both a range and a specific date.
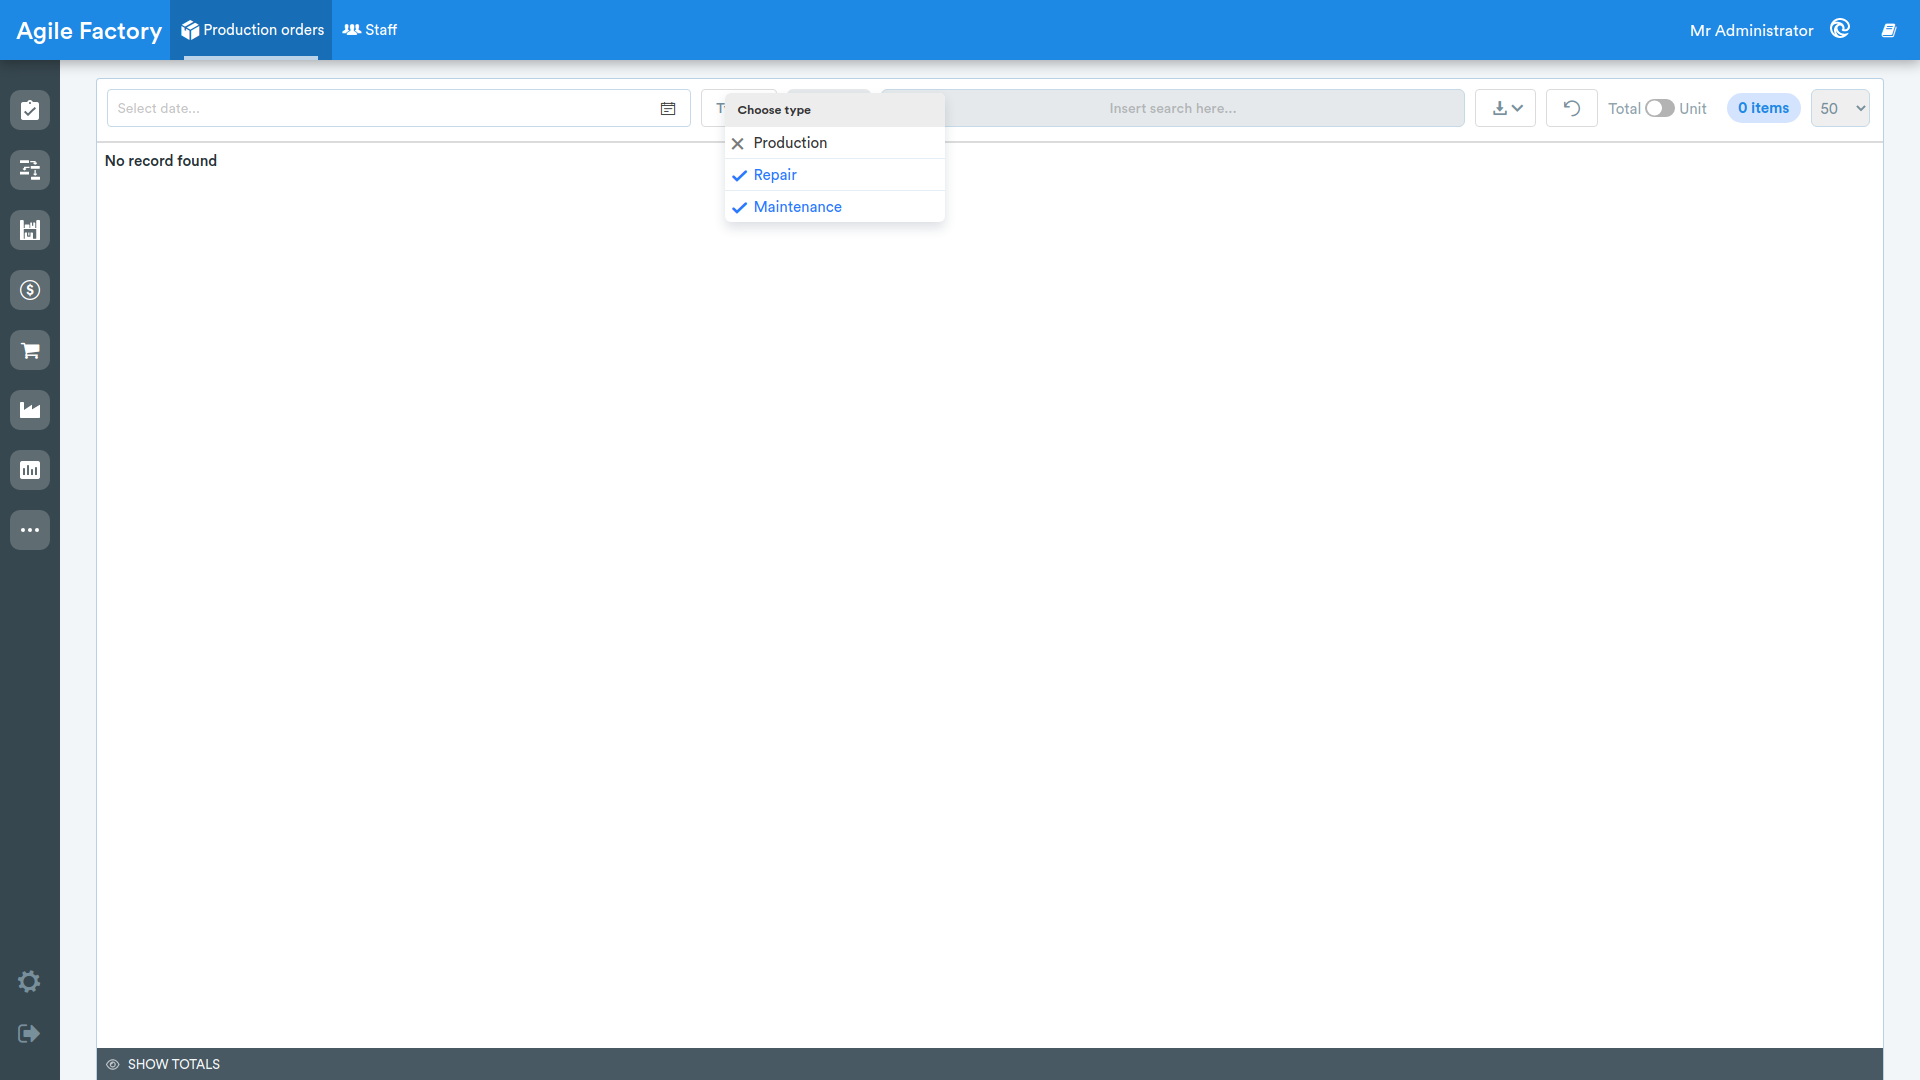
- by type: Production - production orders from the Order Management module, Repair and Maintenance - repair and maintenance orders from the Maintenance module

- by customer and product: these filters are grouped under the Filters button. Clicking the button opens a panel where you can select one or more customers and products; press the Apply button to apply the selection. Active filters are shown as removable chips below the toolbar and can be removed individually.
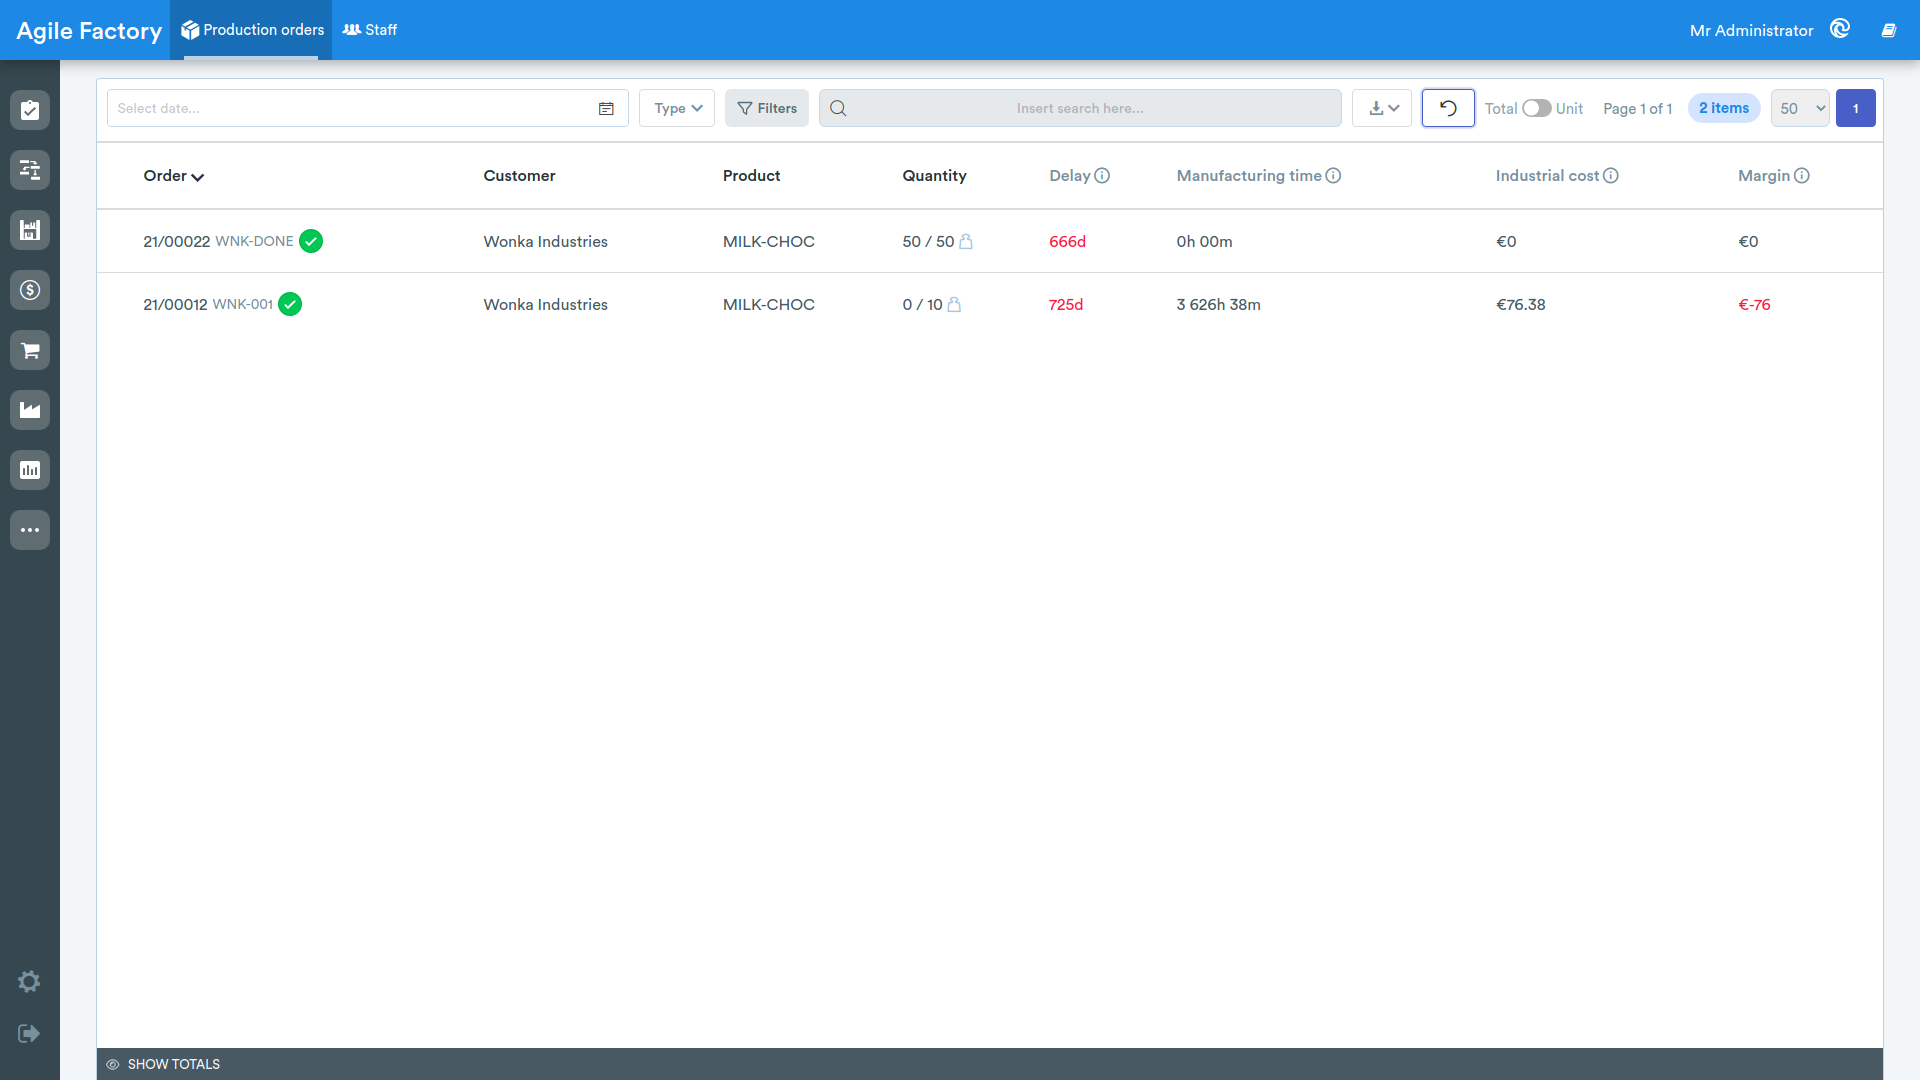
- the search bar: allows filtering the list by typing free text.
The information in the table can also be displayed per production unit.
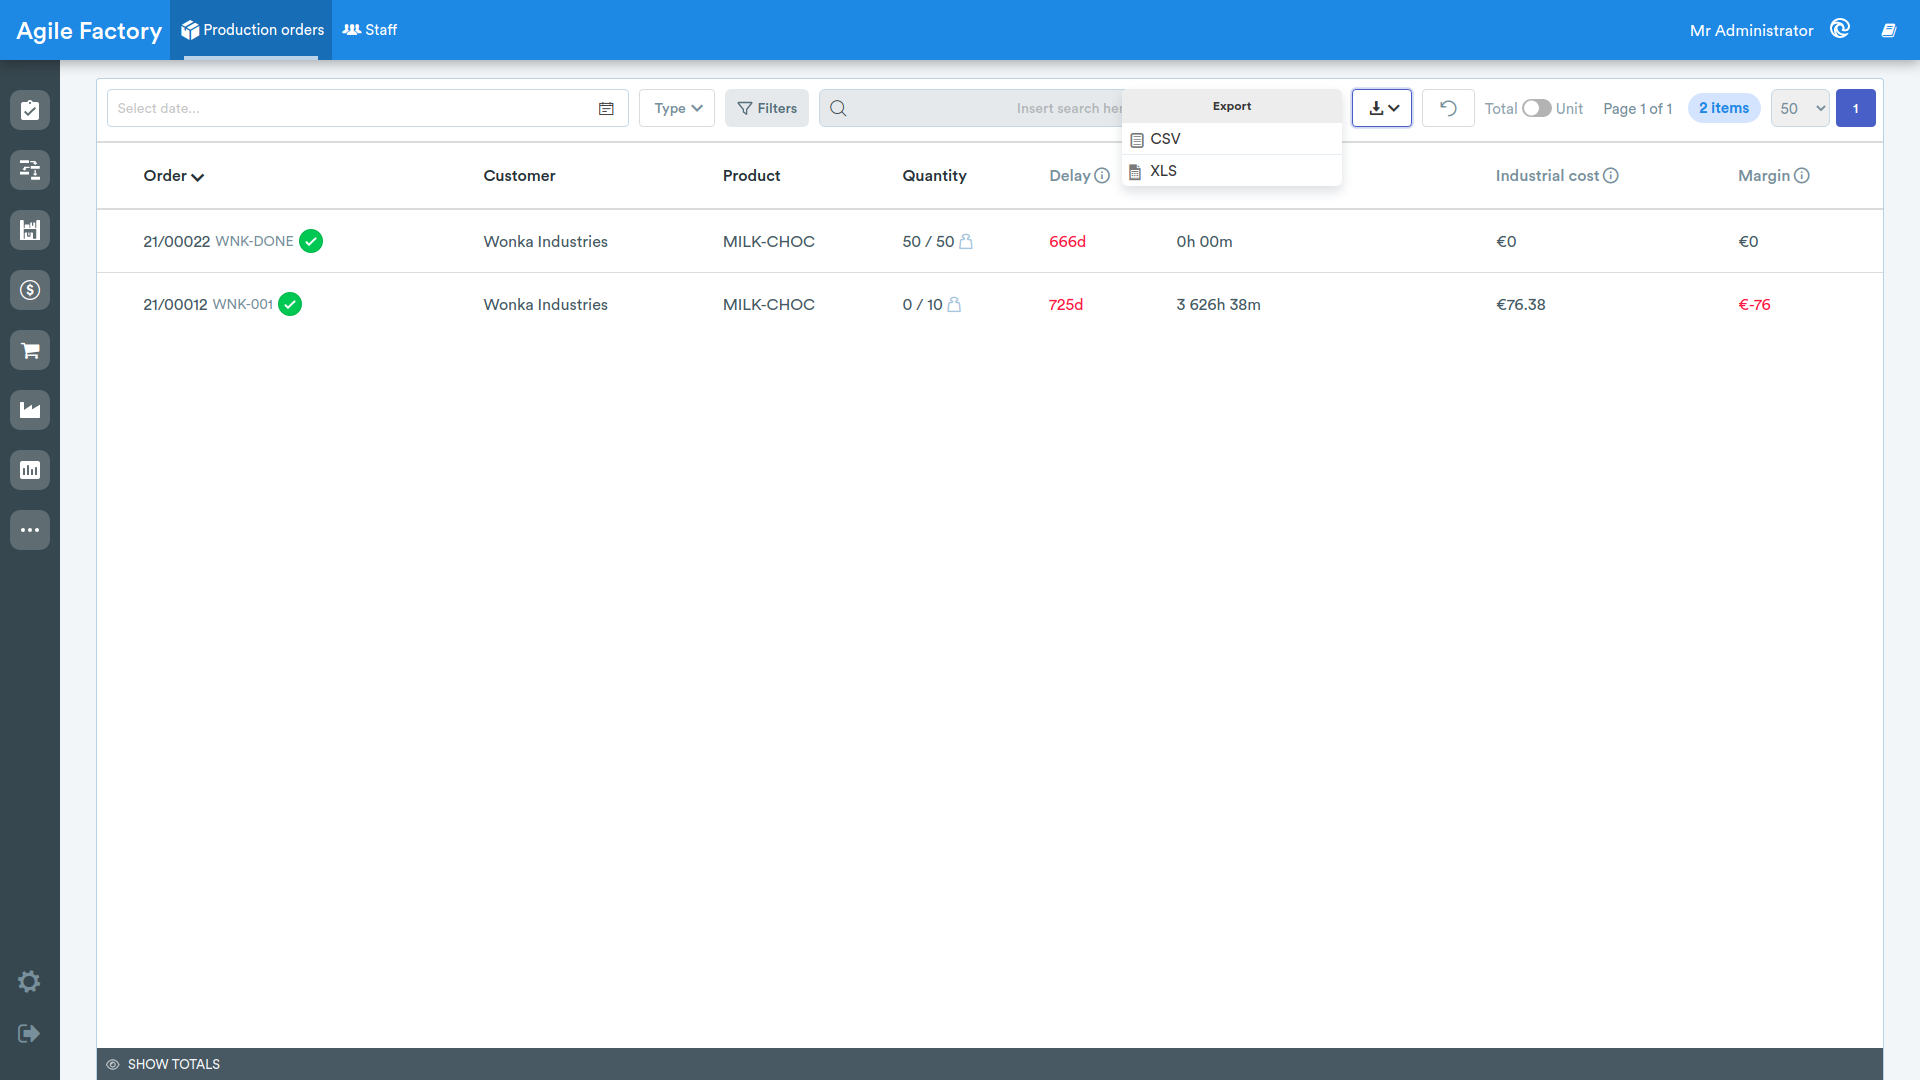
It is also possible to download the data in *.csv and *.xls formats using the button with the arrow in the upper right corner.
The reset button is used to reset all search filters.
Totals
At the bottom of the screen is the tool for aggregating the data displayed on the screen.
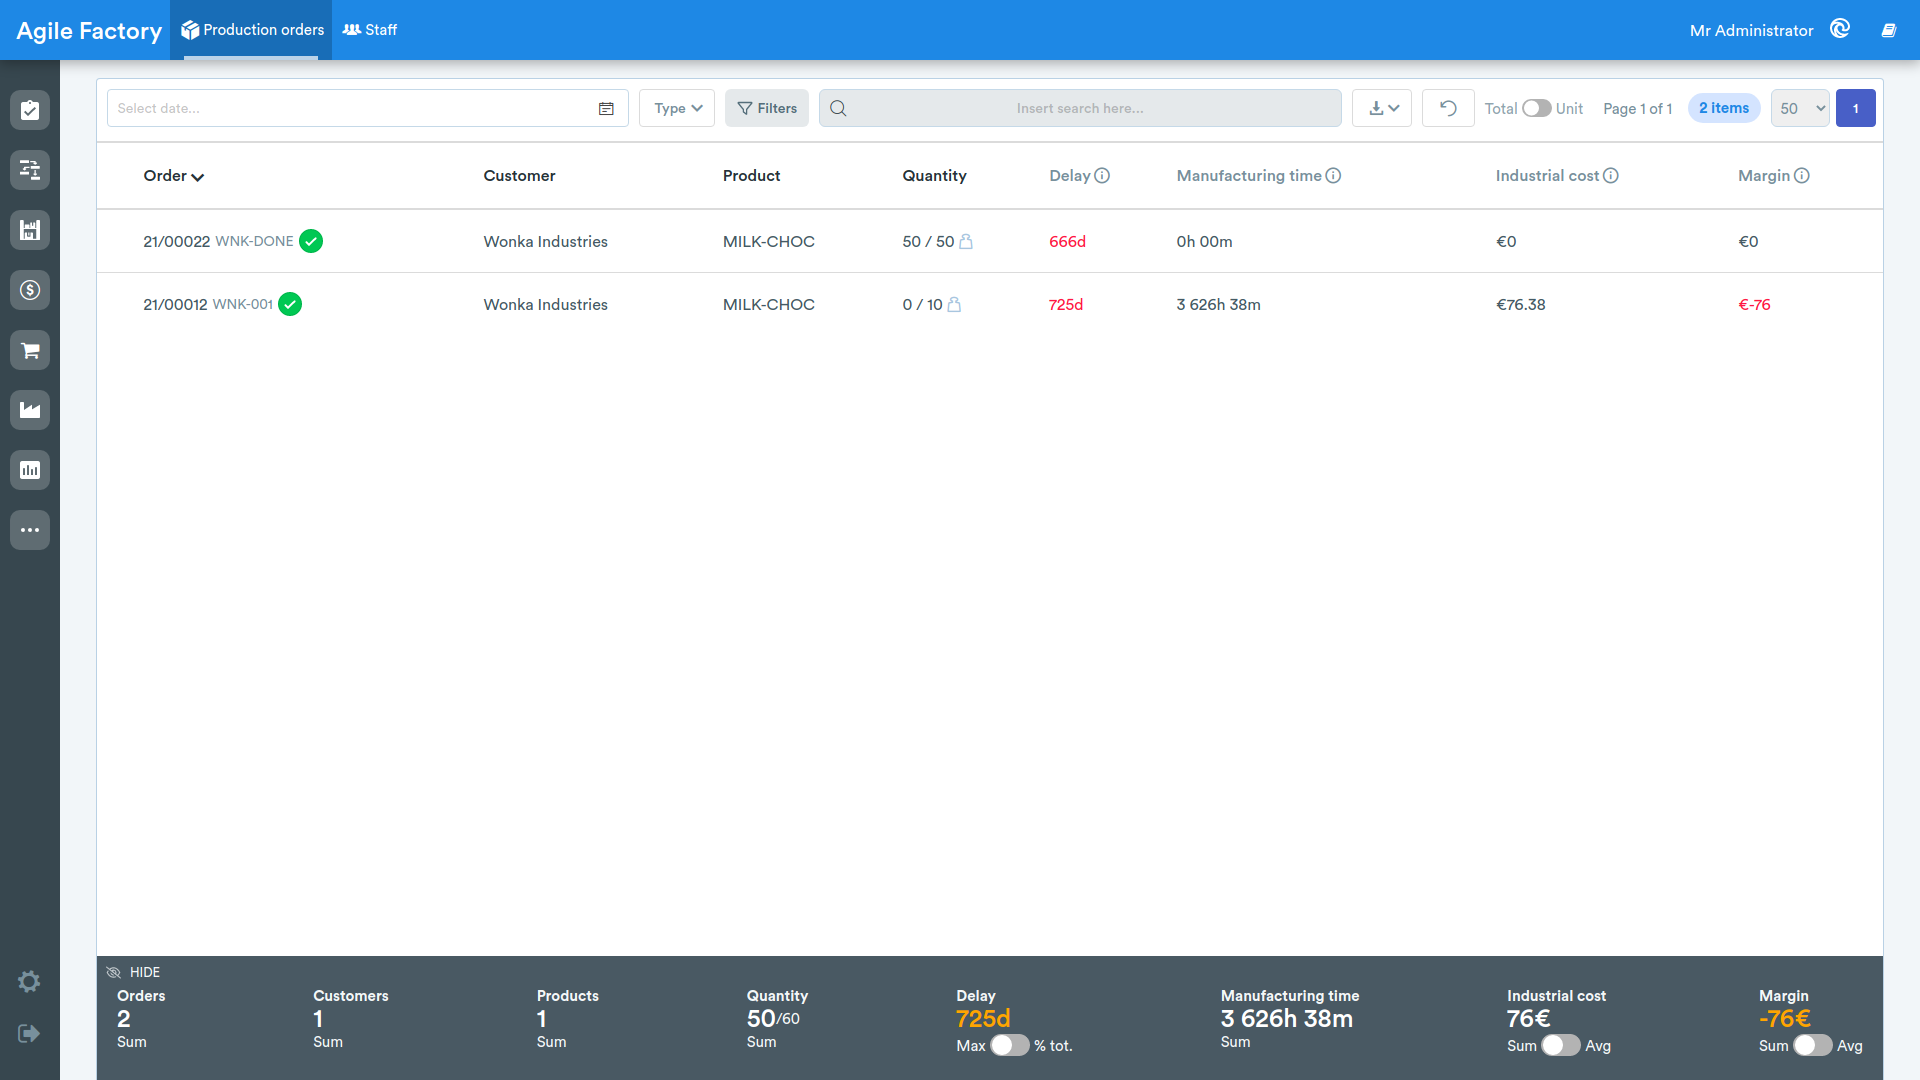
- Order: number of orders on the page.
- Customer: number of customers.
- Item: number of products.
- Quantity: sum for quantity produced / expected quantity.
- Delay: early/late compared to expected delivery date in days or as a percentage of the total number of orders in the list.
- Production time: sum of actual production times.
- Industrial cost: sum or average of industrial costs.
- Margin: sum or average of revenues.
The aggregated data also varies depending on the position of the Total/Unit switch. It is also possible to hide the totals by pressing the Hide button on the left side.
Order Details
By selecting one of the production orders from the list, it is possible to view various details and KPIs related to execution.
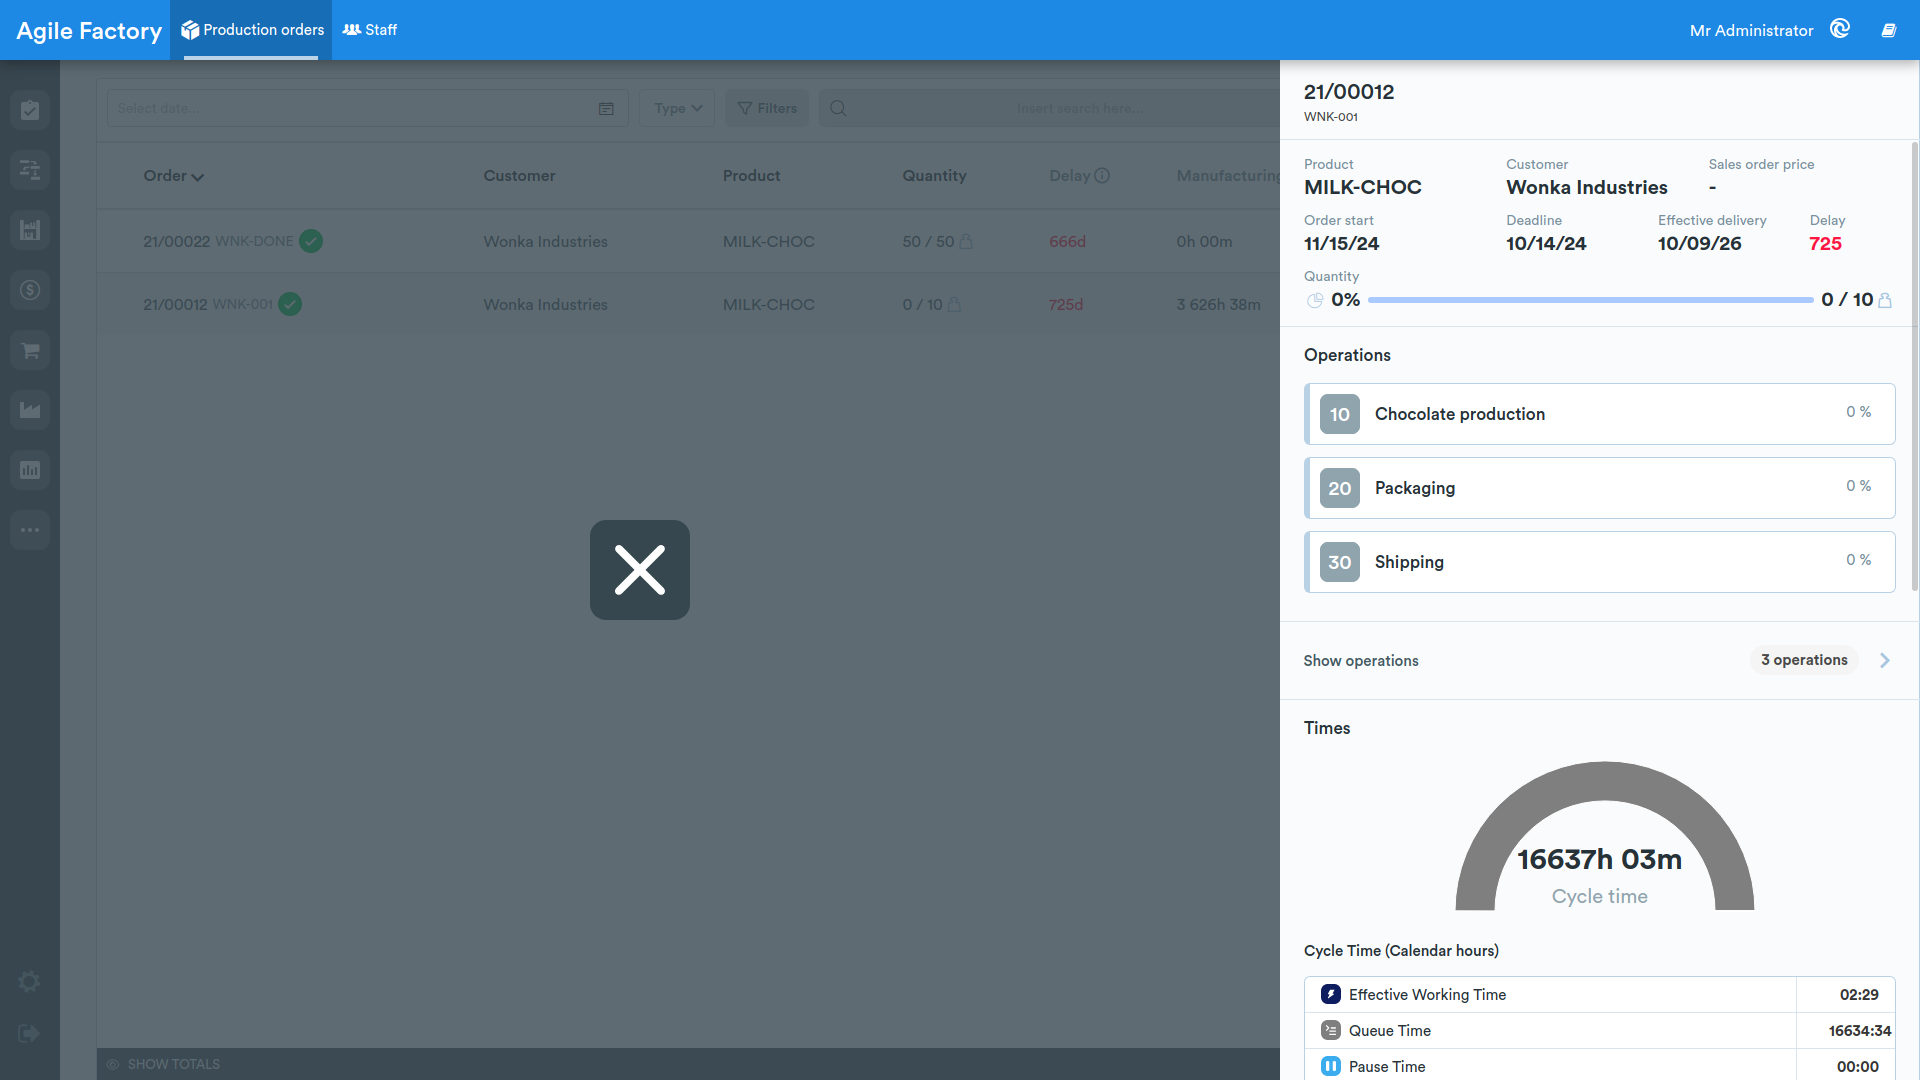
By selecting one of the operations, it is possible to view the indicators related to that specific operation.
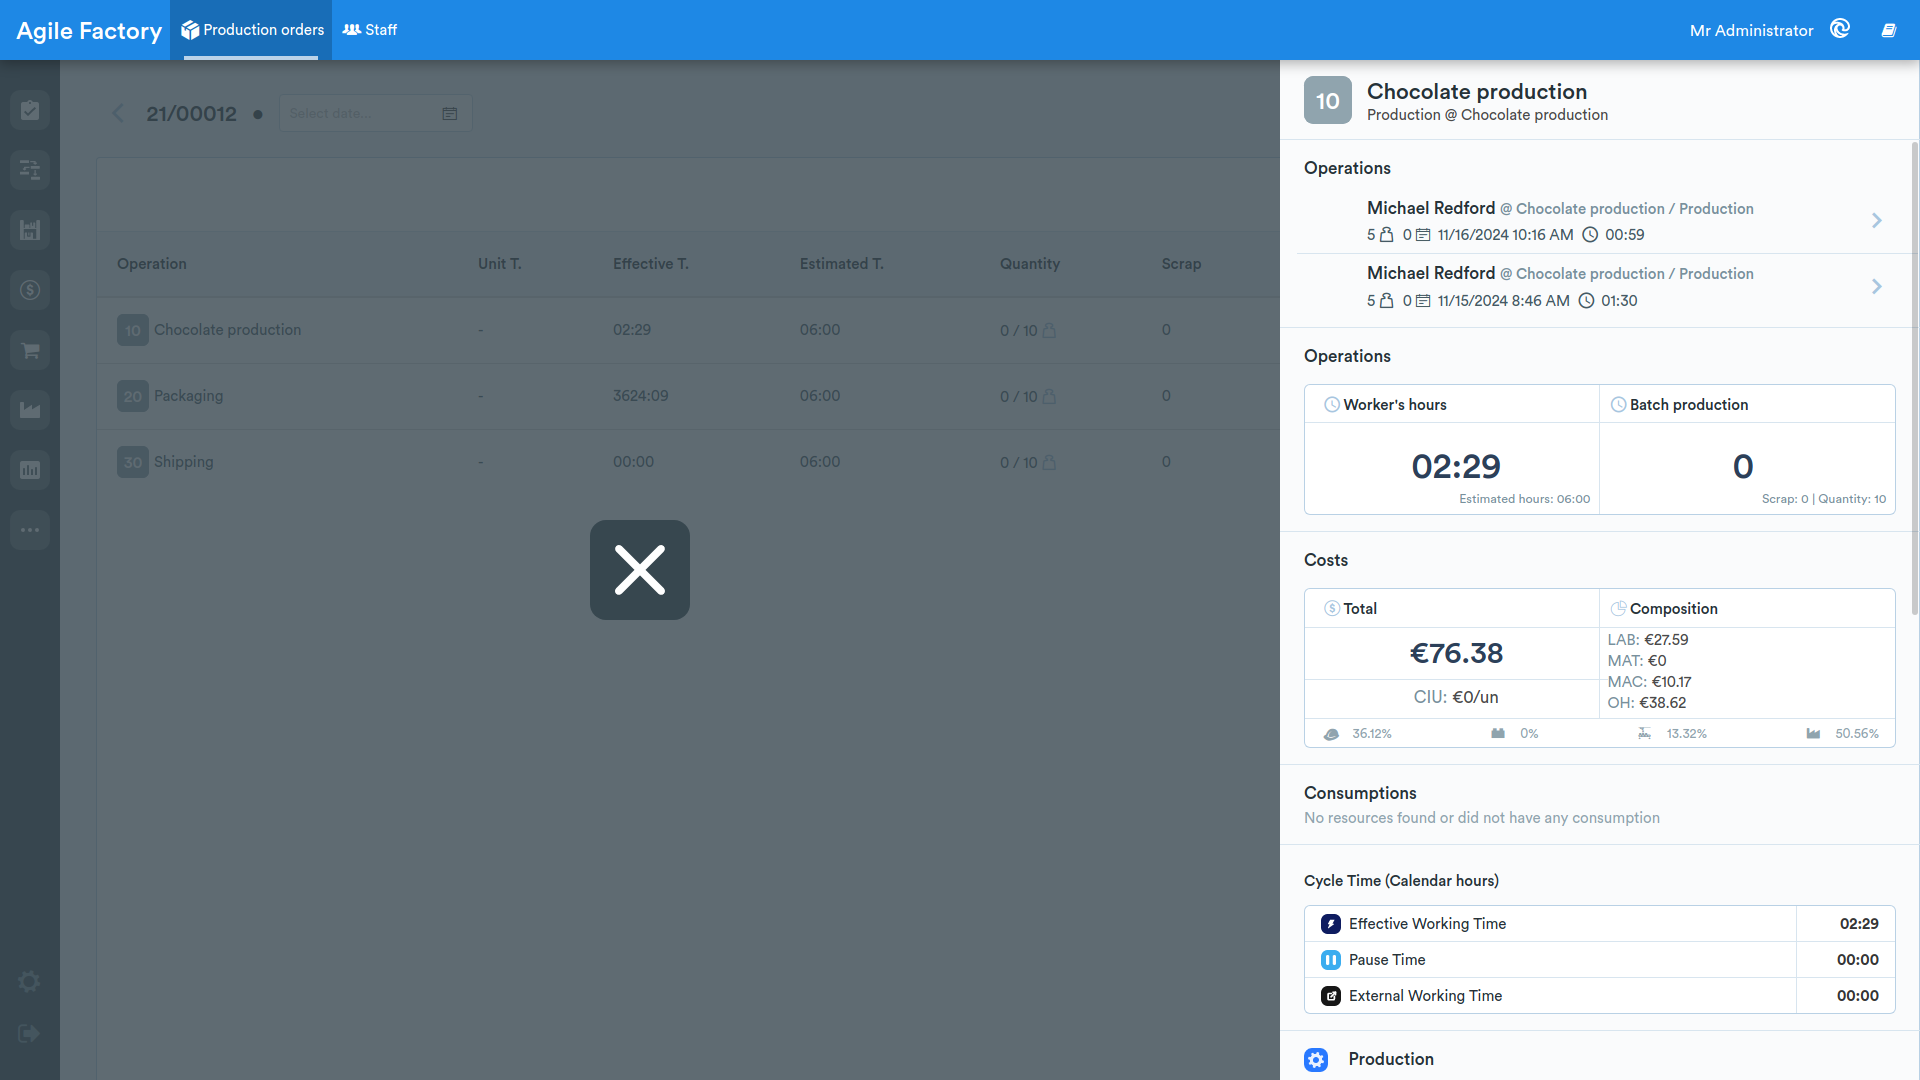
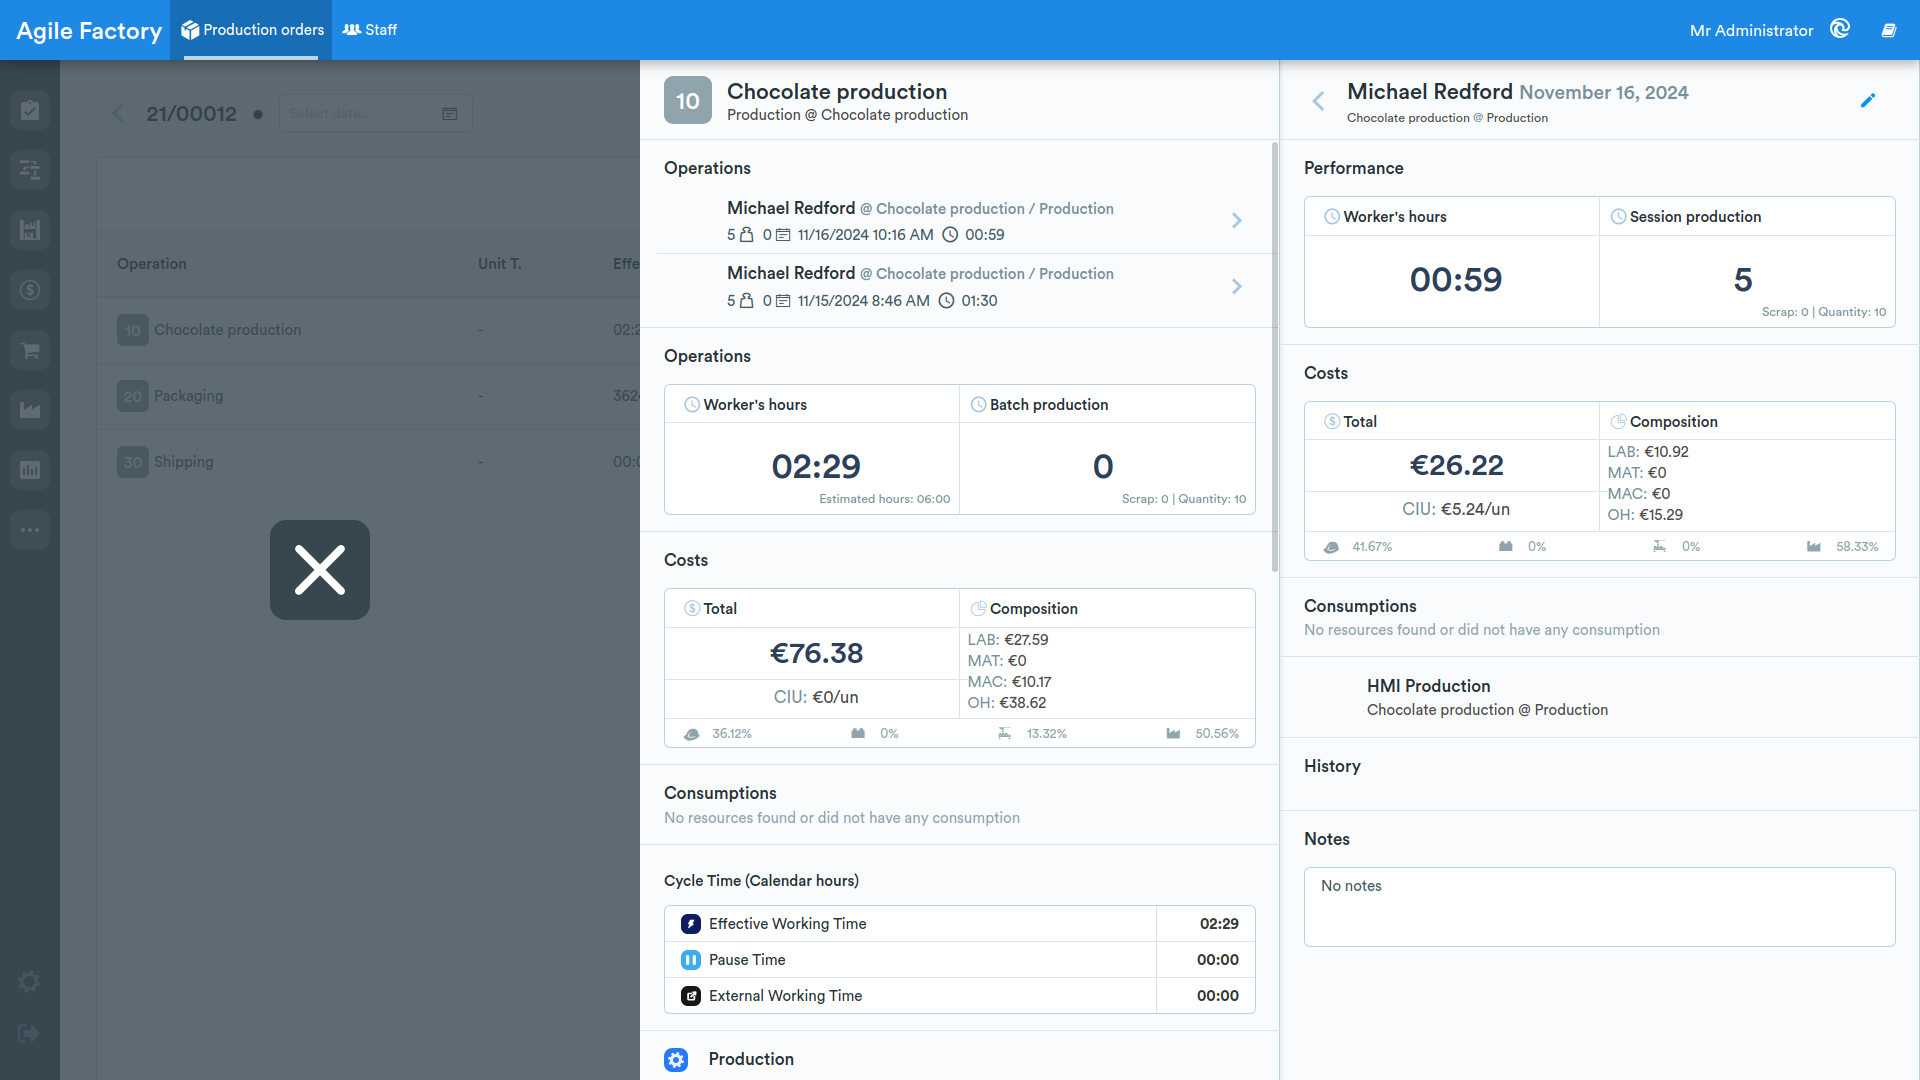
It is also possible to analyze the details of the work sessions, so that this tool allows identifying the main causes of deviations down to the specific work session of a specific employee.
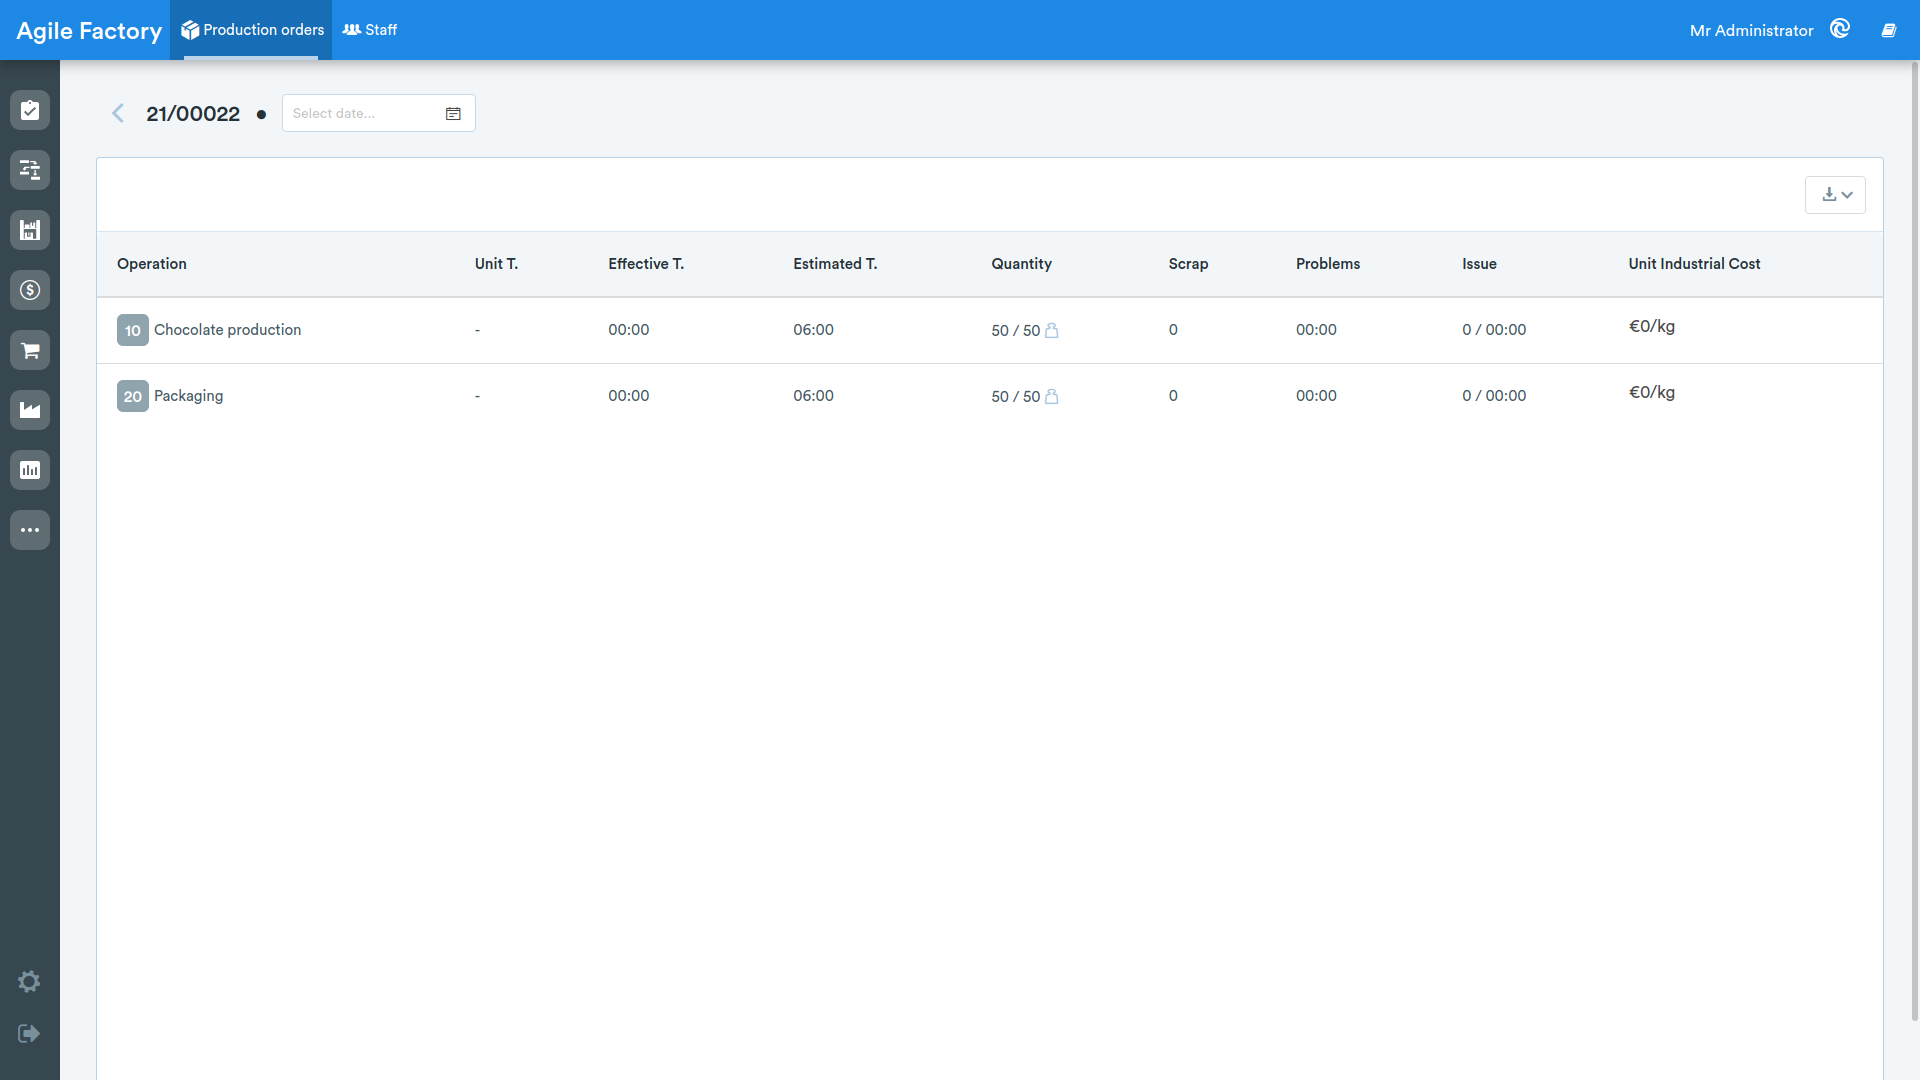
The interface also allows you to select operation details by clicking on View operation details and to view operation efficiency indicators in tabular form.
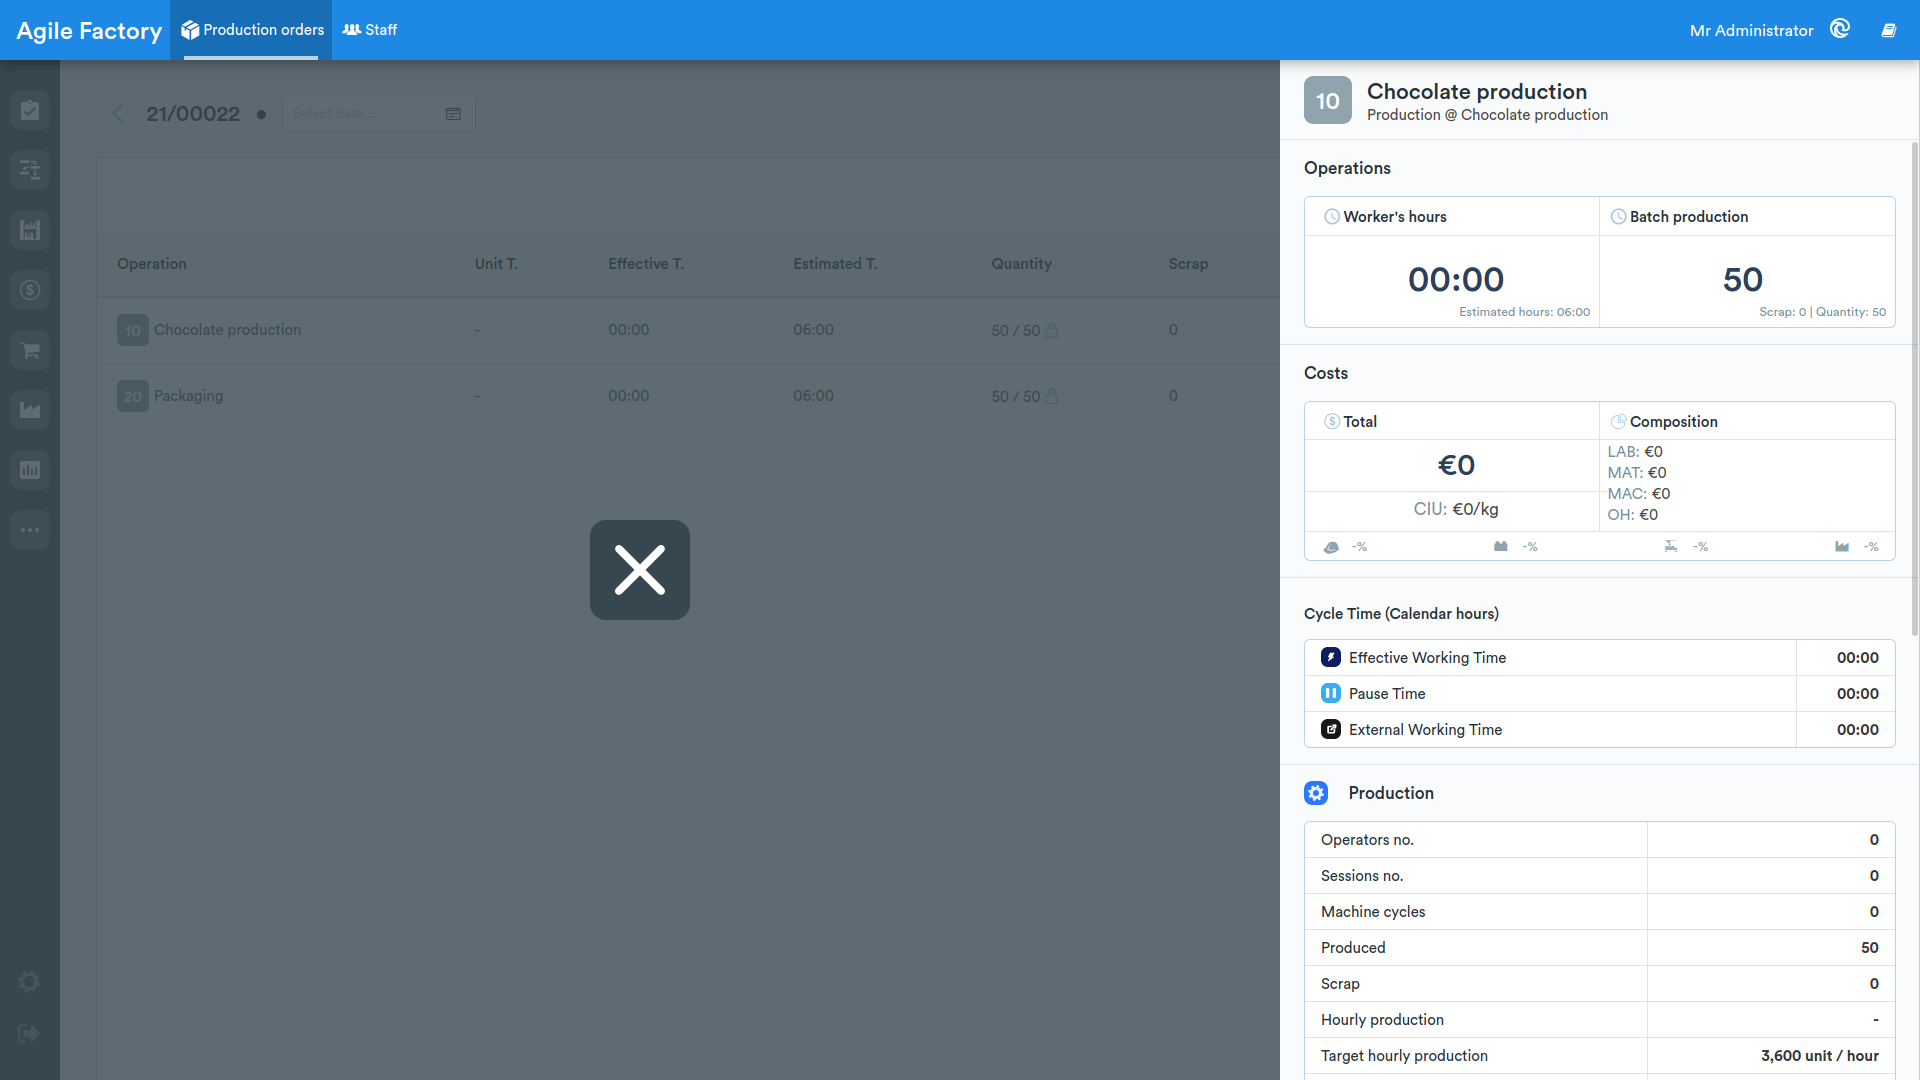
For each of the presented operations, it is possible to view the details.
Personnel
Main View
This section contains analytical data and tools related to people. The main view consists of a list of operators with the following columns:
- Name: operator name.
- Calendar hours/Available hours: sum of hours according to the calendar, excluding lunches / calendar hours minus delays and absences.
- Labor cost: cost of hours according to the calendar.
- Actual hours: calendar working hours with all orders during a day.
- Value-added costs: costs associated with value-added activities, equal to actual hours multiplied by the hourly cost of labor.
- Downtime: calendar hours minus actual hours.
- Downtime cost: downtime multiplied by the hourly cost of labor / percentage of downtime cost compared to labor cost.
- MES utilization: percentage ratio between actual hours and available hours.
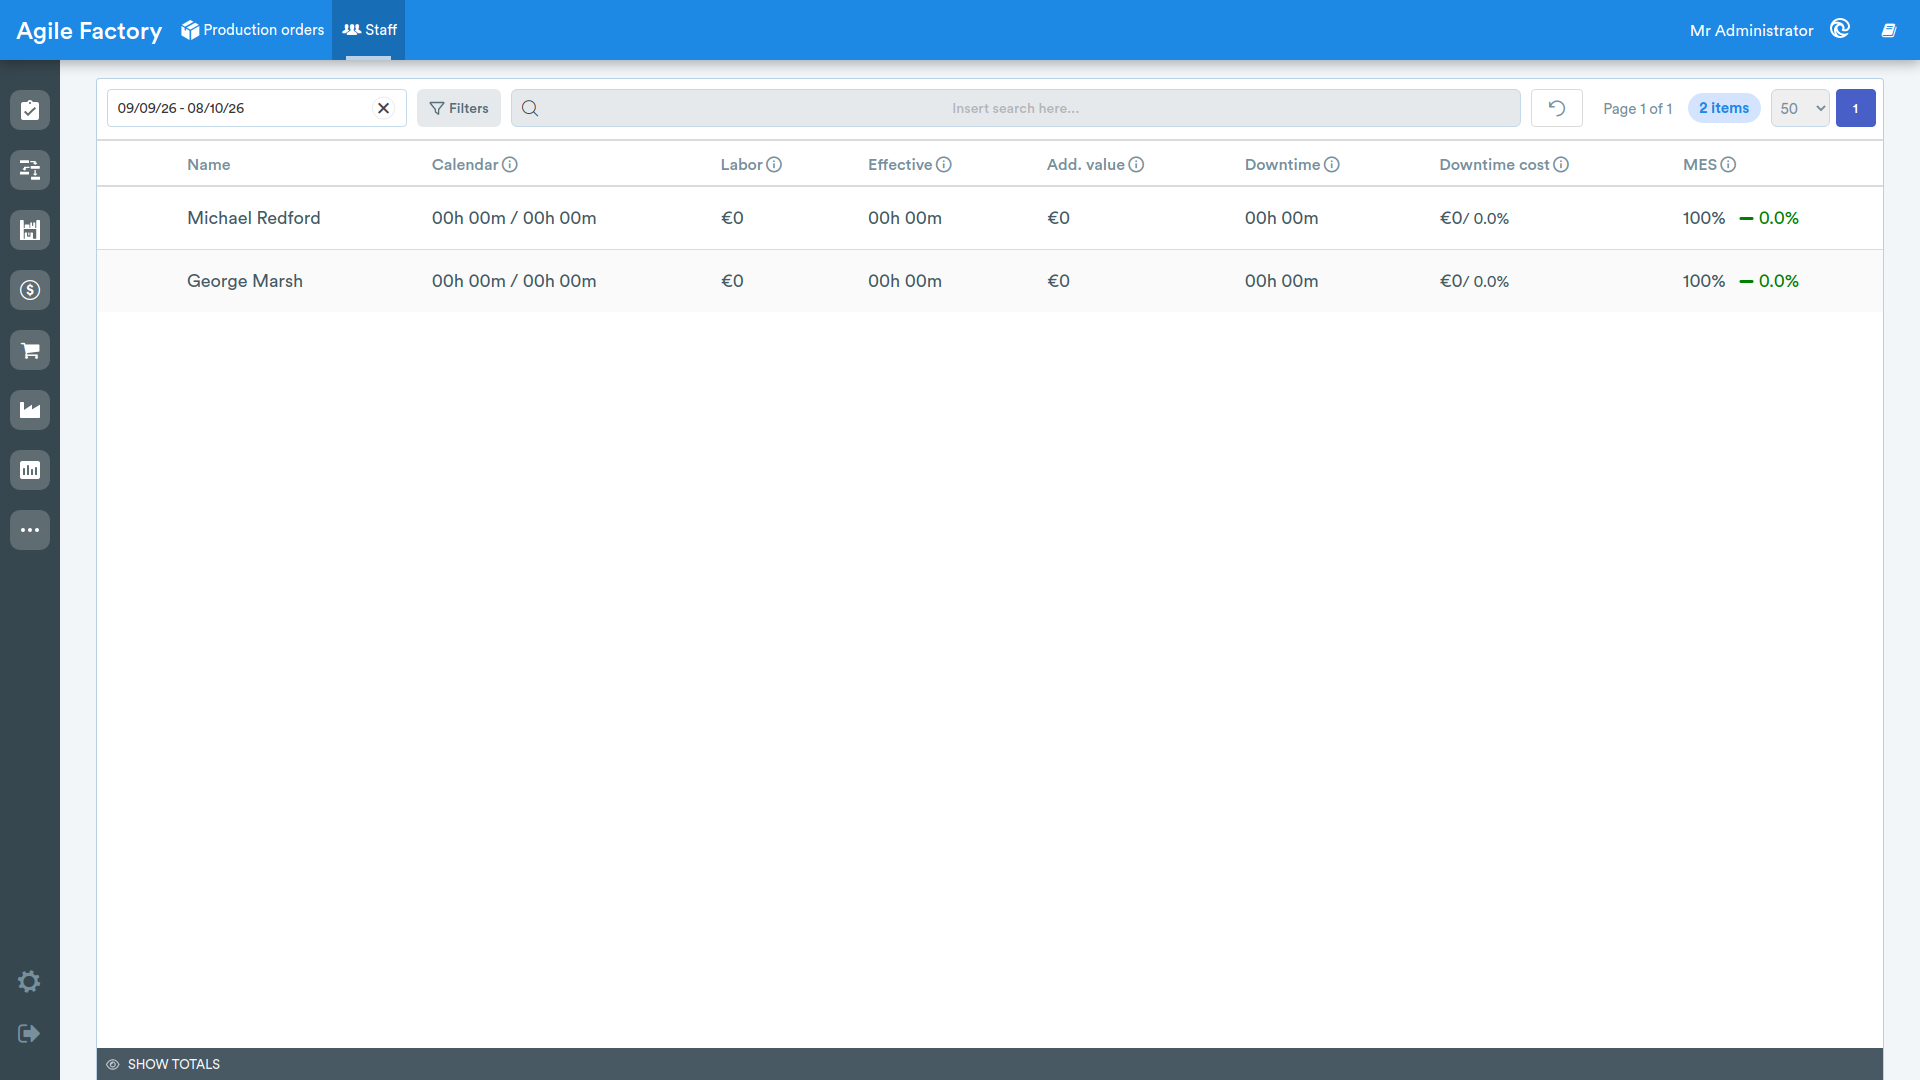
Above the tabular data, a date filter, customer and product filters, and a search bar are available.
- the date filter: it is possible to select both a range and a specific date.
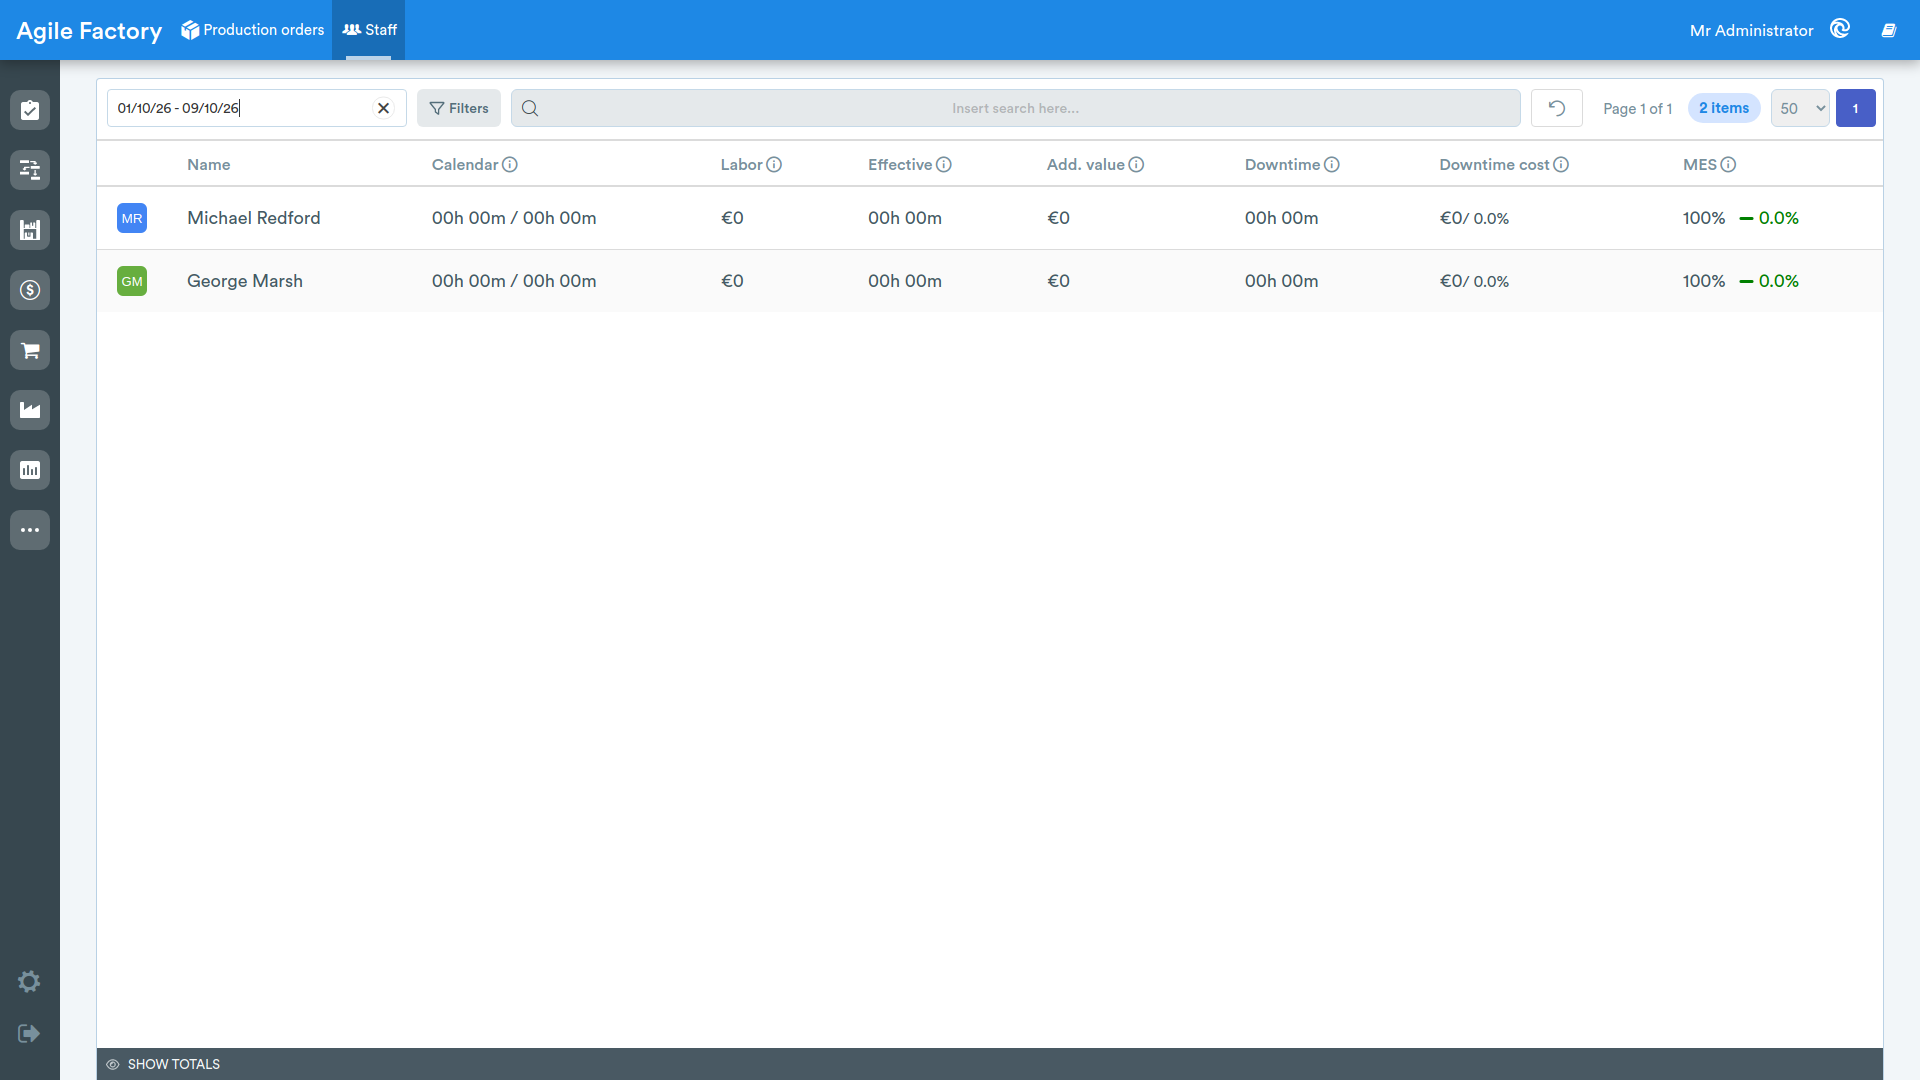
-
the customer and product filters: these are grouped under the Filters button. Clicking the button opens a panel where you can select one or more customers and products; press the Apply button to apply the selection. Active filters are shown as removable chips below the toolbar and can be removed individually.
-
the search bar.
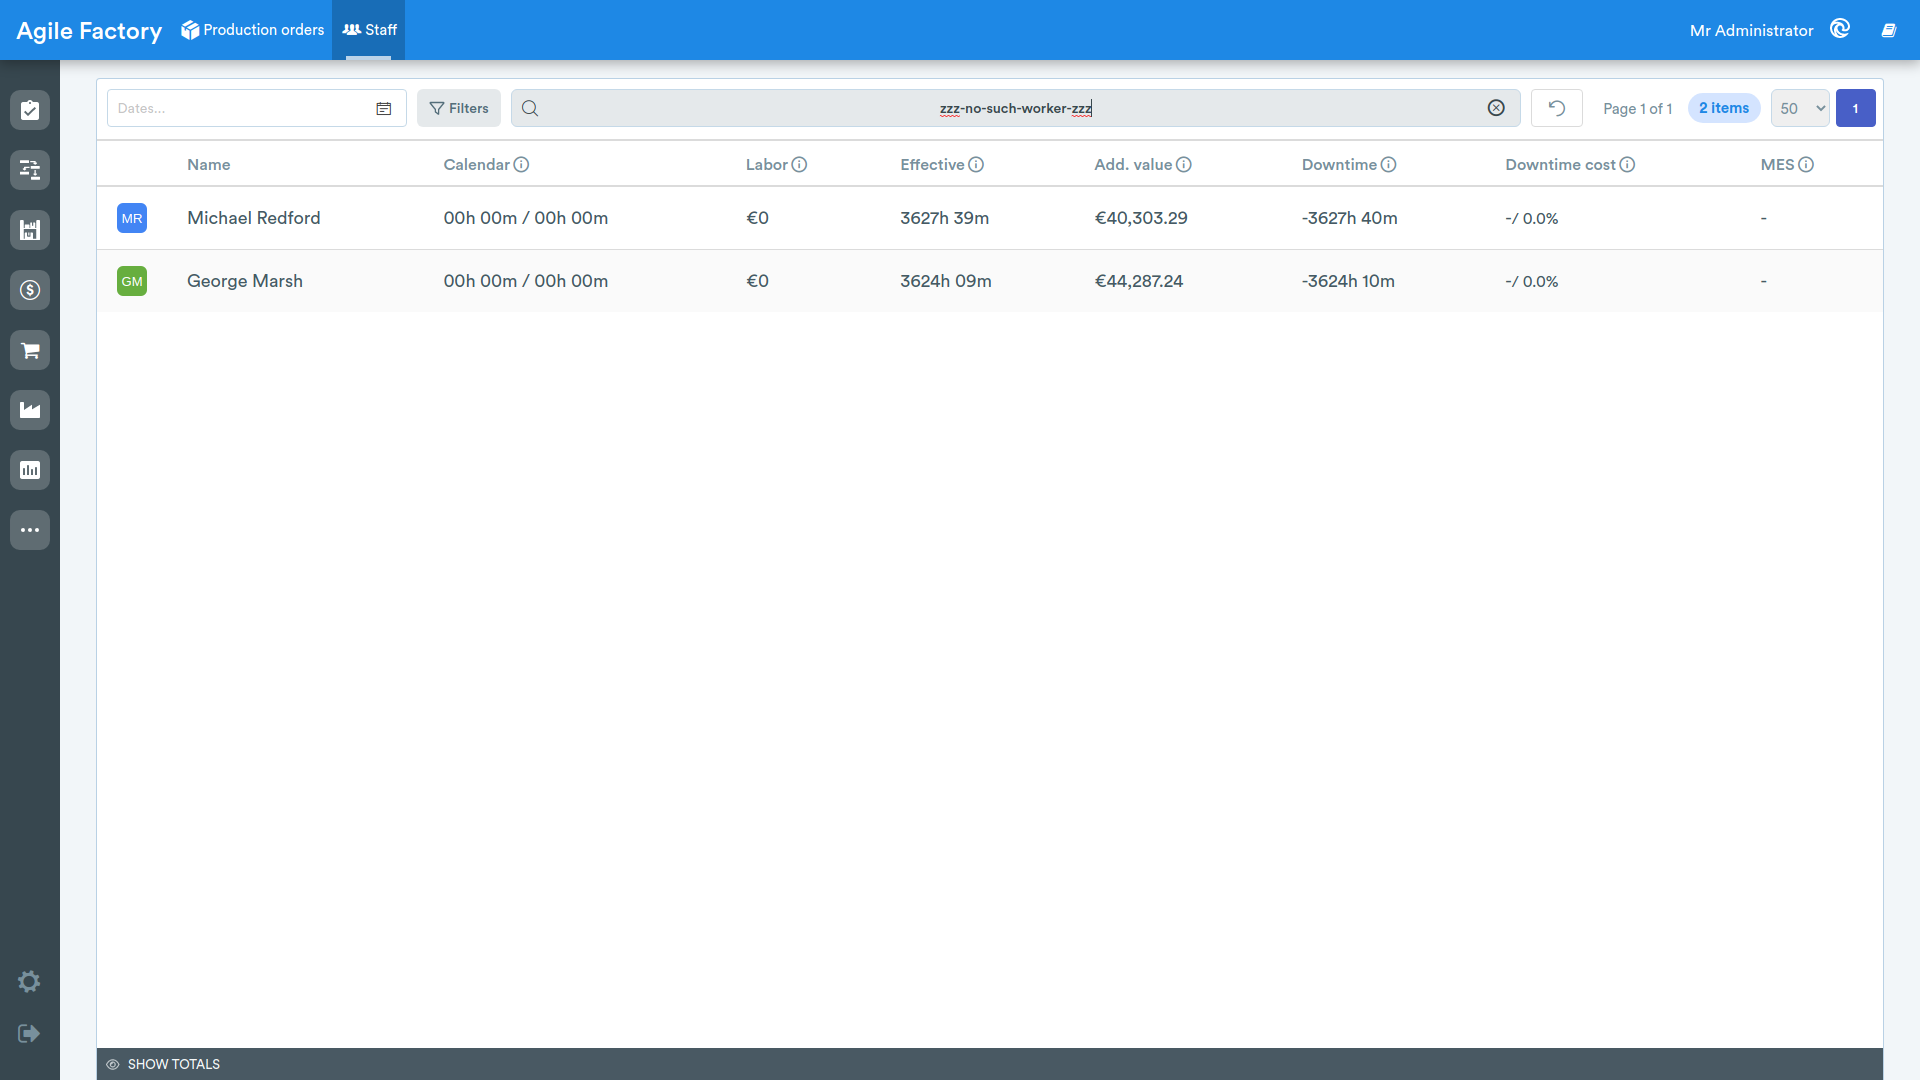
The reset button is used to reset all search filters.
Totals
At the bottom of the screen is the tool for aggregating the data displayed on the screen.
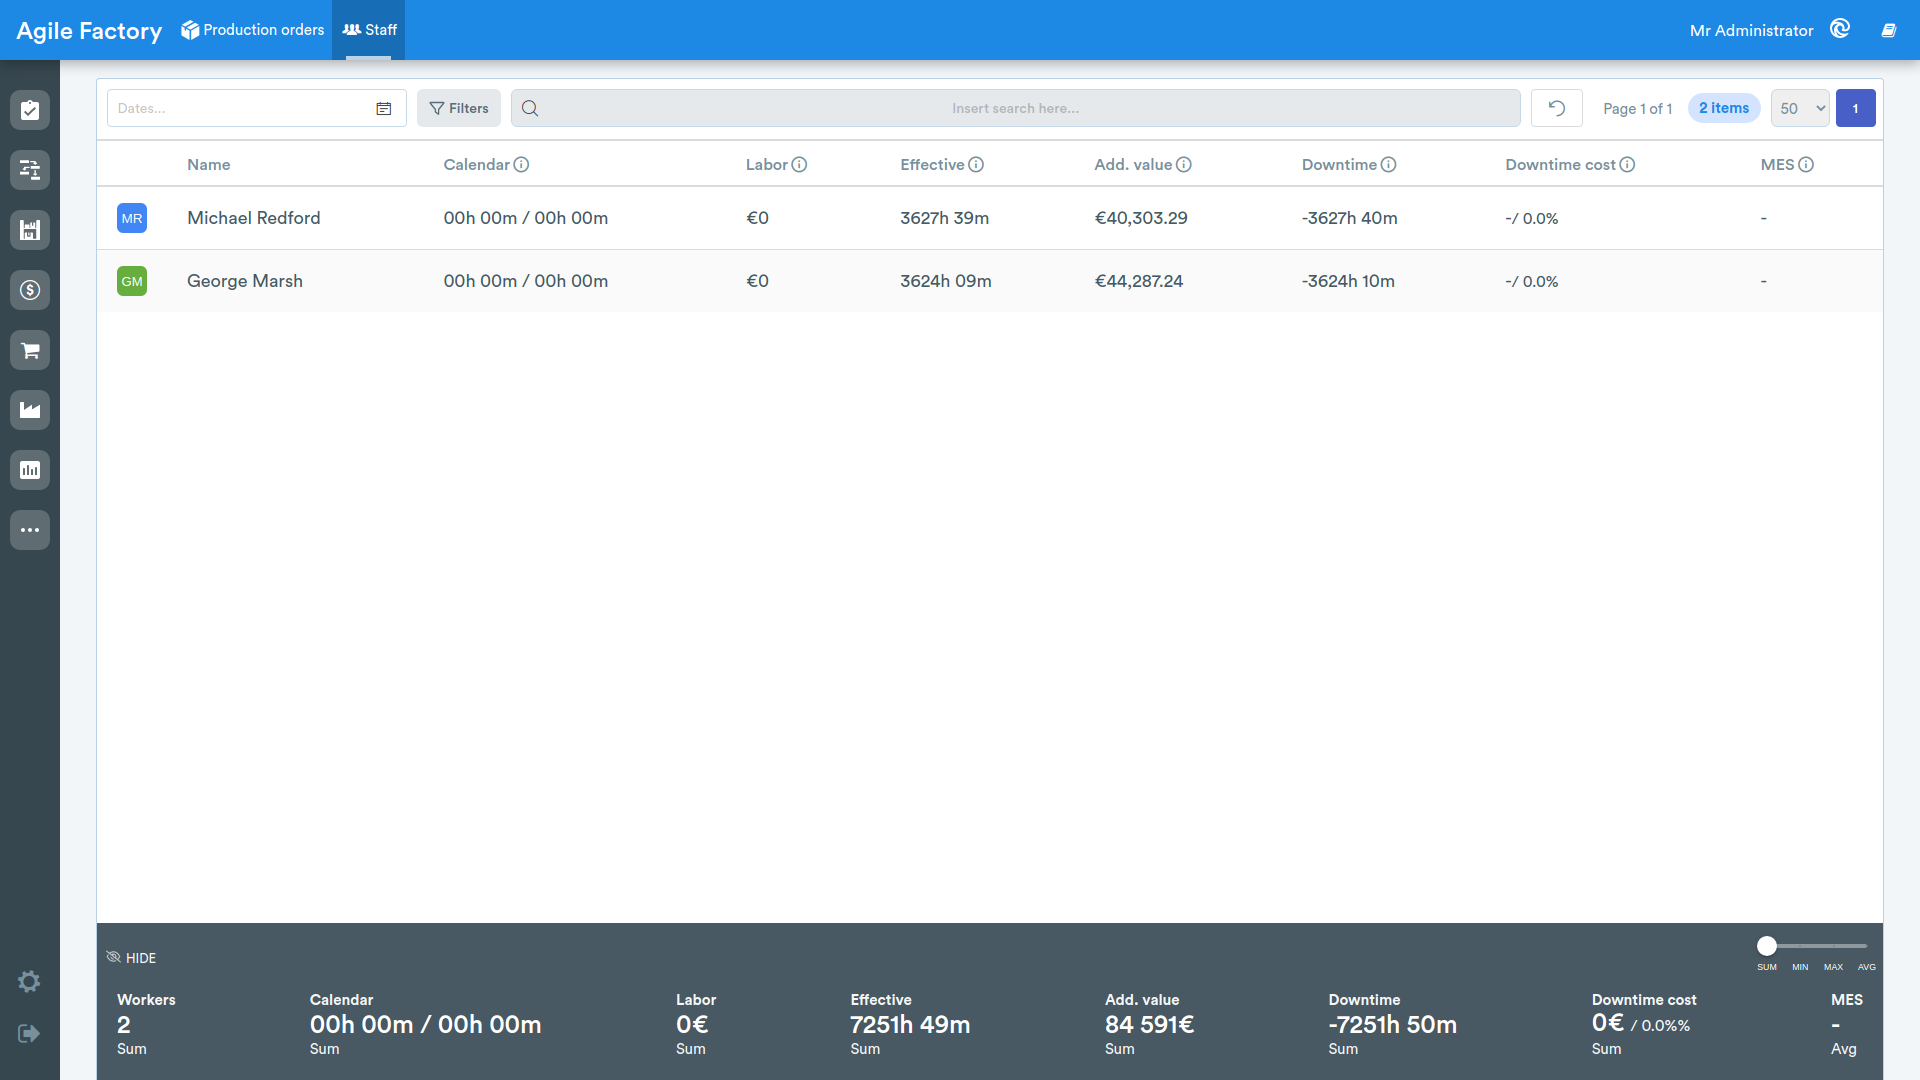
- Workers: number of workers.
- Calendar hours/Available hours: sum of hours according to the calendar, excluding lunches / calendar hours minus delays and absences.
- Labor cost: aggregation of the cost of hours according to the calendar.
- Actual hours: aggregation of calendar working hours with all orders during a day.
- Value-added costs: aggregation of costs associated with value-added activities.
- Downtime: aggregation of downtime.
- Downtime cost: aggregation of downtime cost.
- MES utilization: aggregation of MES utilization.
On the right side of the totals is an aggregation type selector (sum, minimum, maximum, average). It is also possible to hide the totals by pressing the Hide button on the left side.
Employee Details
By selecting one of the employees from the list, it is possible to view various detailed information and KPIs related to the selected person.
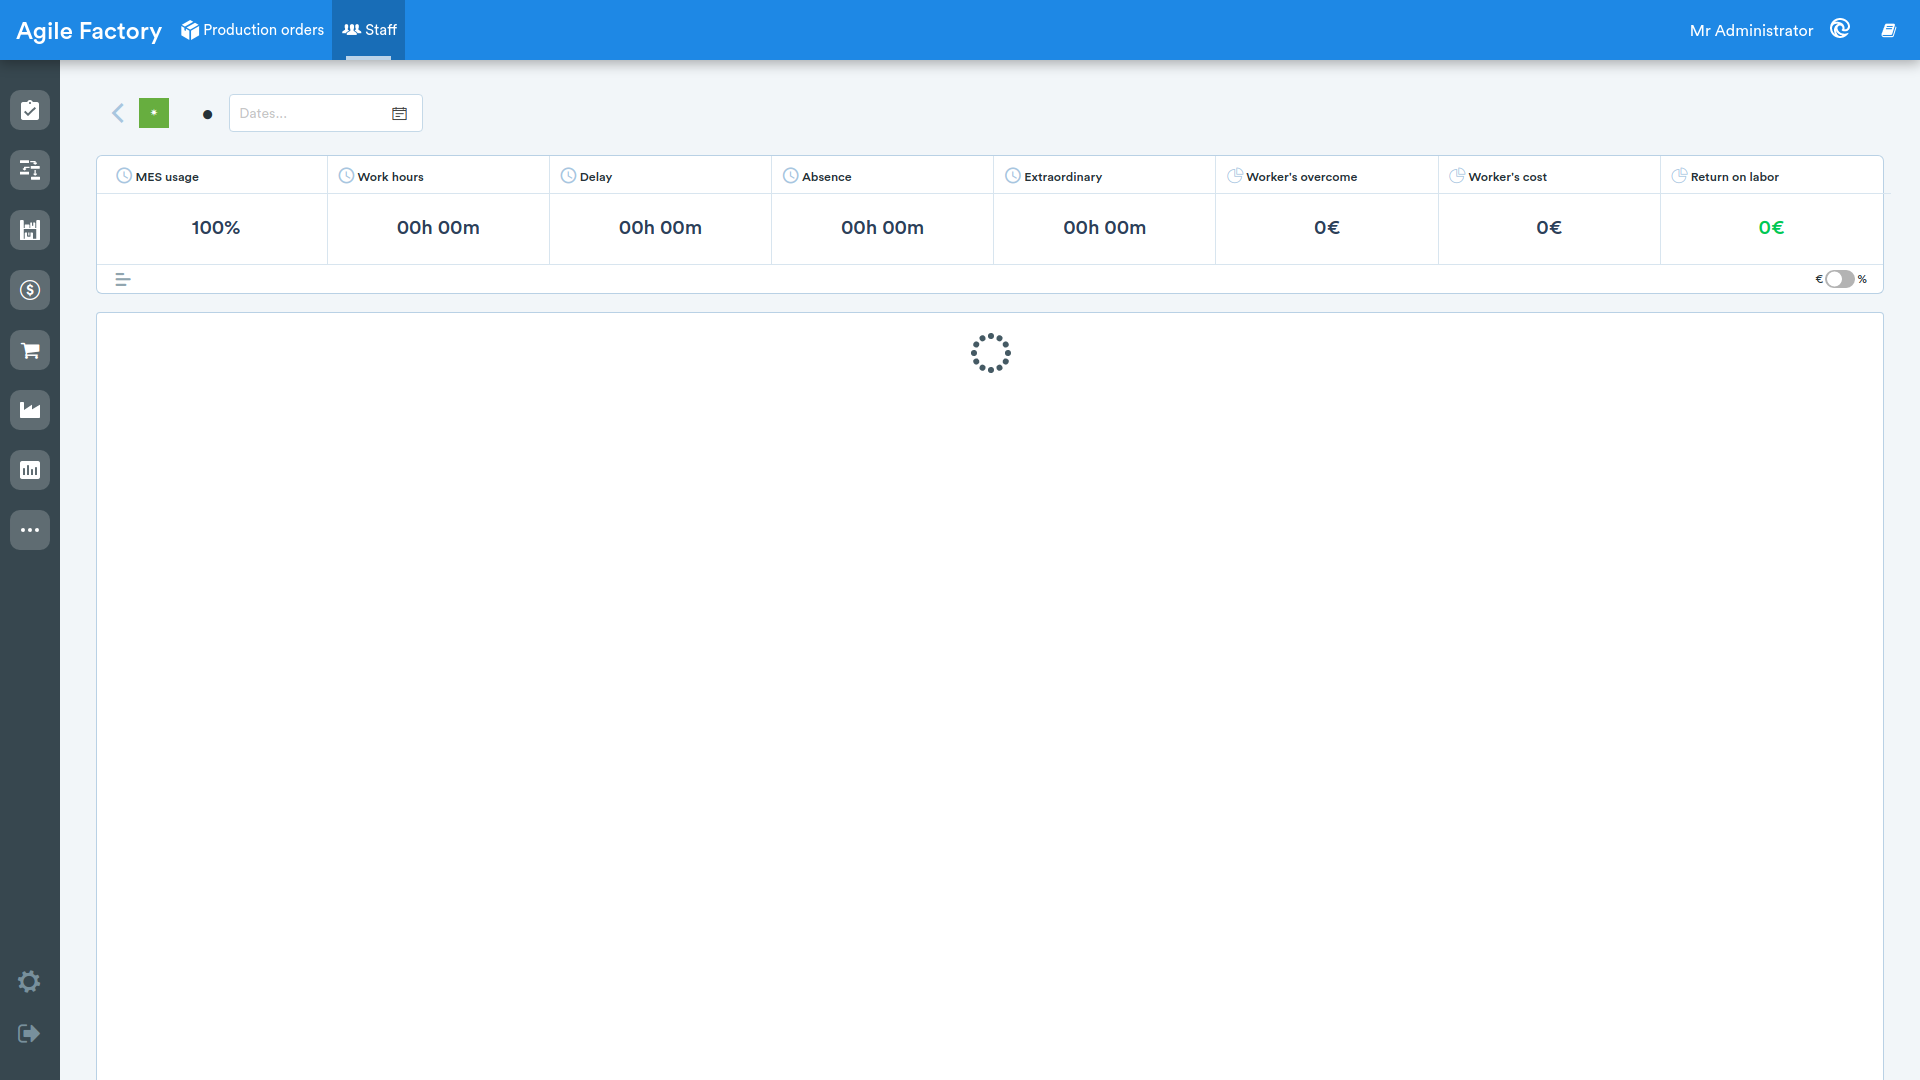
At the top of the interface, aggregated data is reported related to the selected employee and time period.
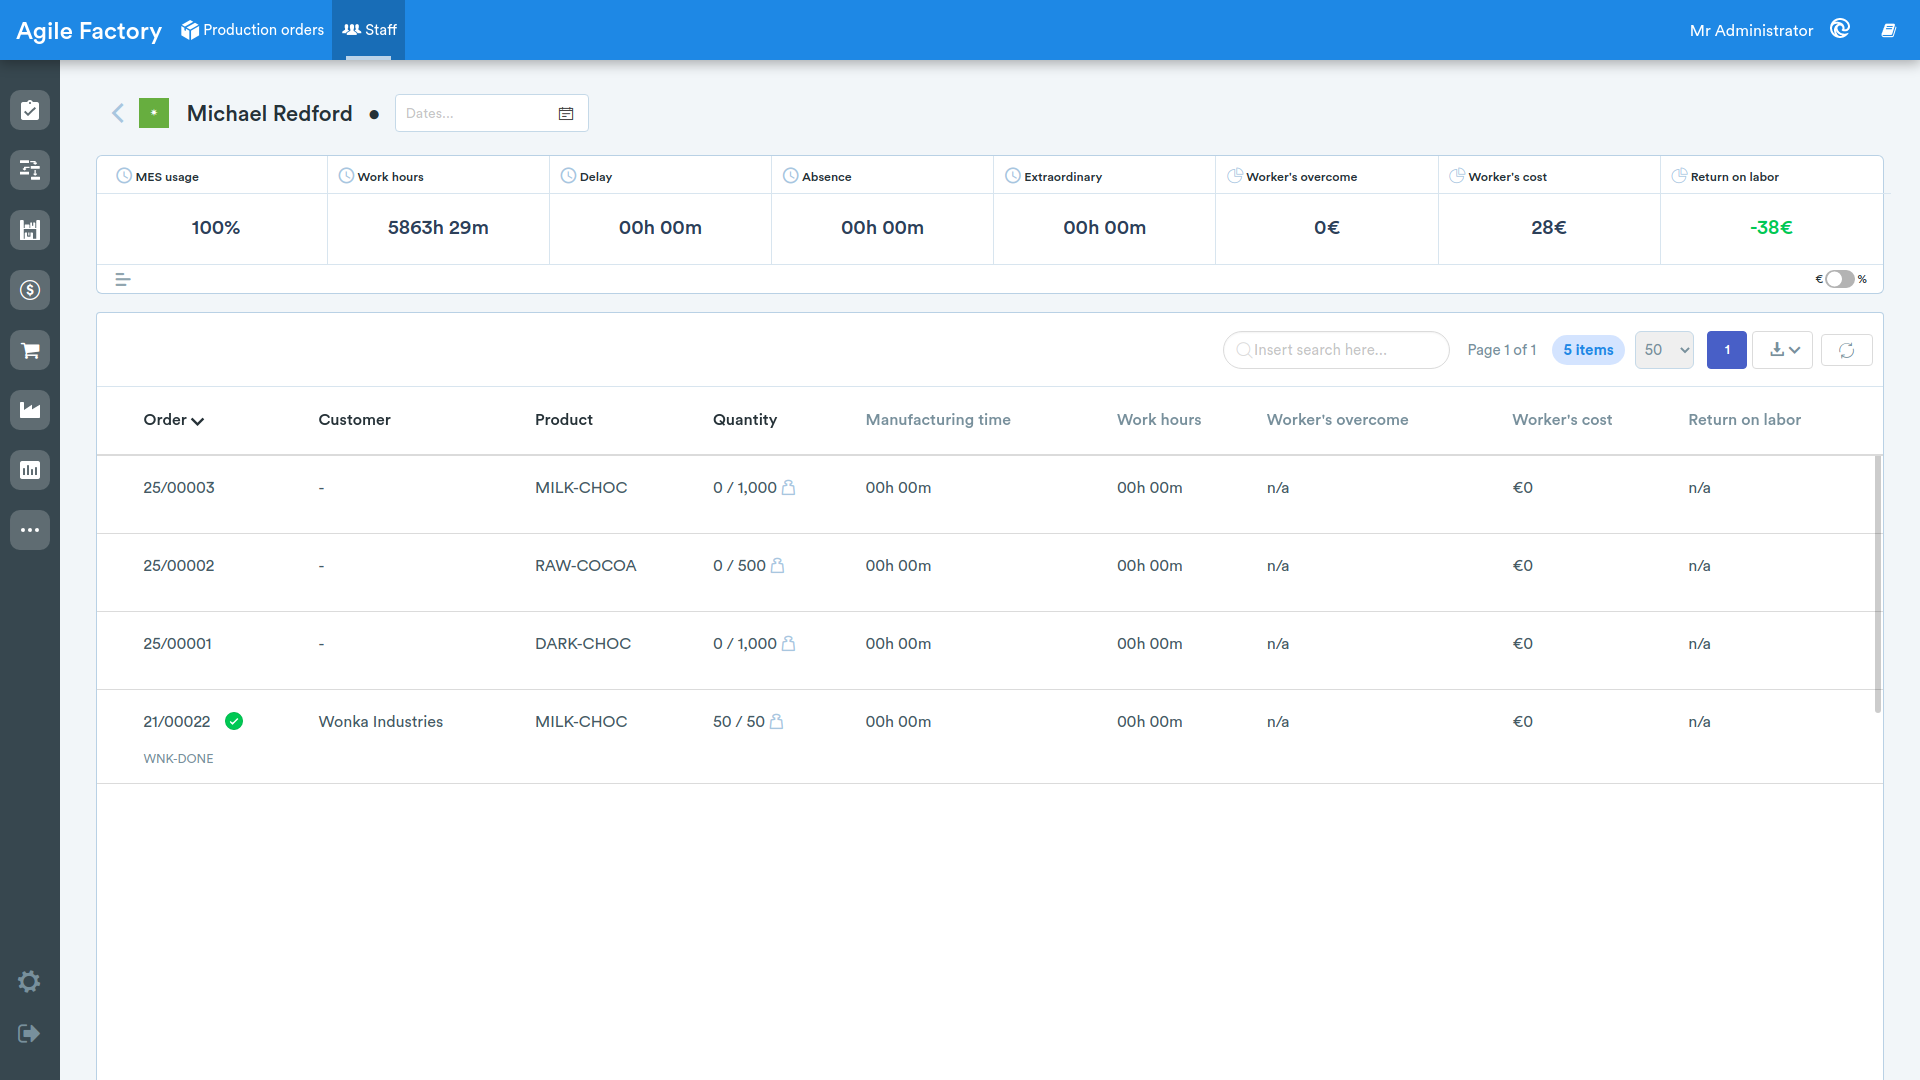
- MES utilization: aggregation of MES utilization.
- Working hours: sum of hours according to the calendar.
- Delay: sum of delays.
- Absence: sum of absences.
- Overtime: sum of overtime.
- Personal income: sum of revenues per employee.
- Worker cost: cost of working hours.
- Return on labor: labor profitability.
Labor profitability can be expressed in both real terms and as a percentage (when the value is negative, it is displayed in red, while when it is positive, it is displayed in green).
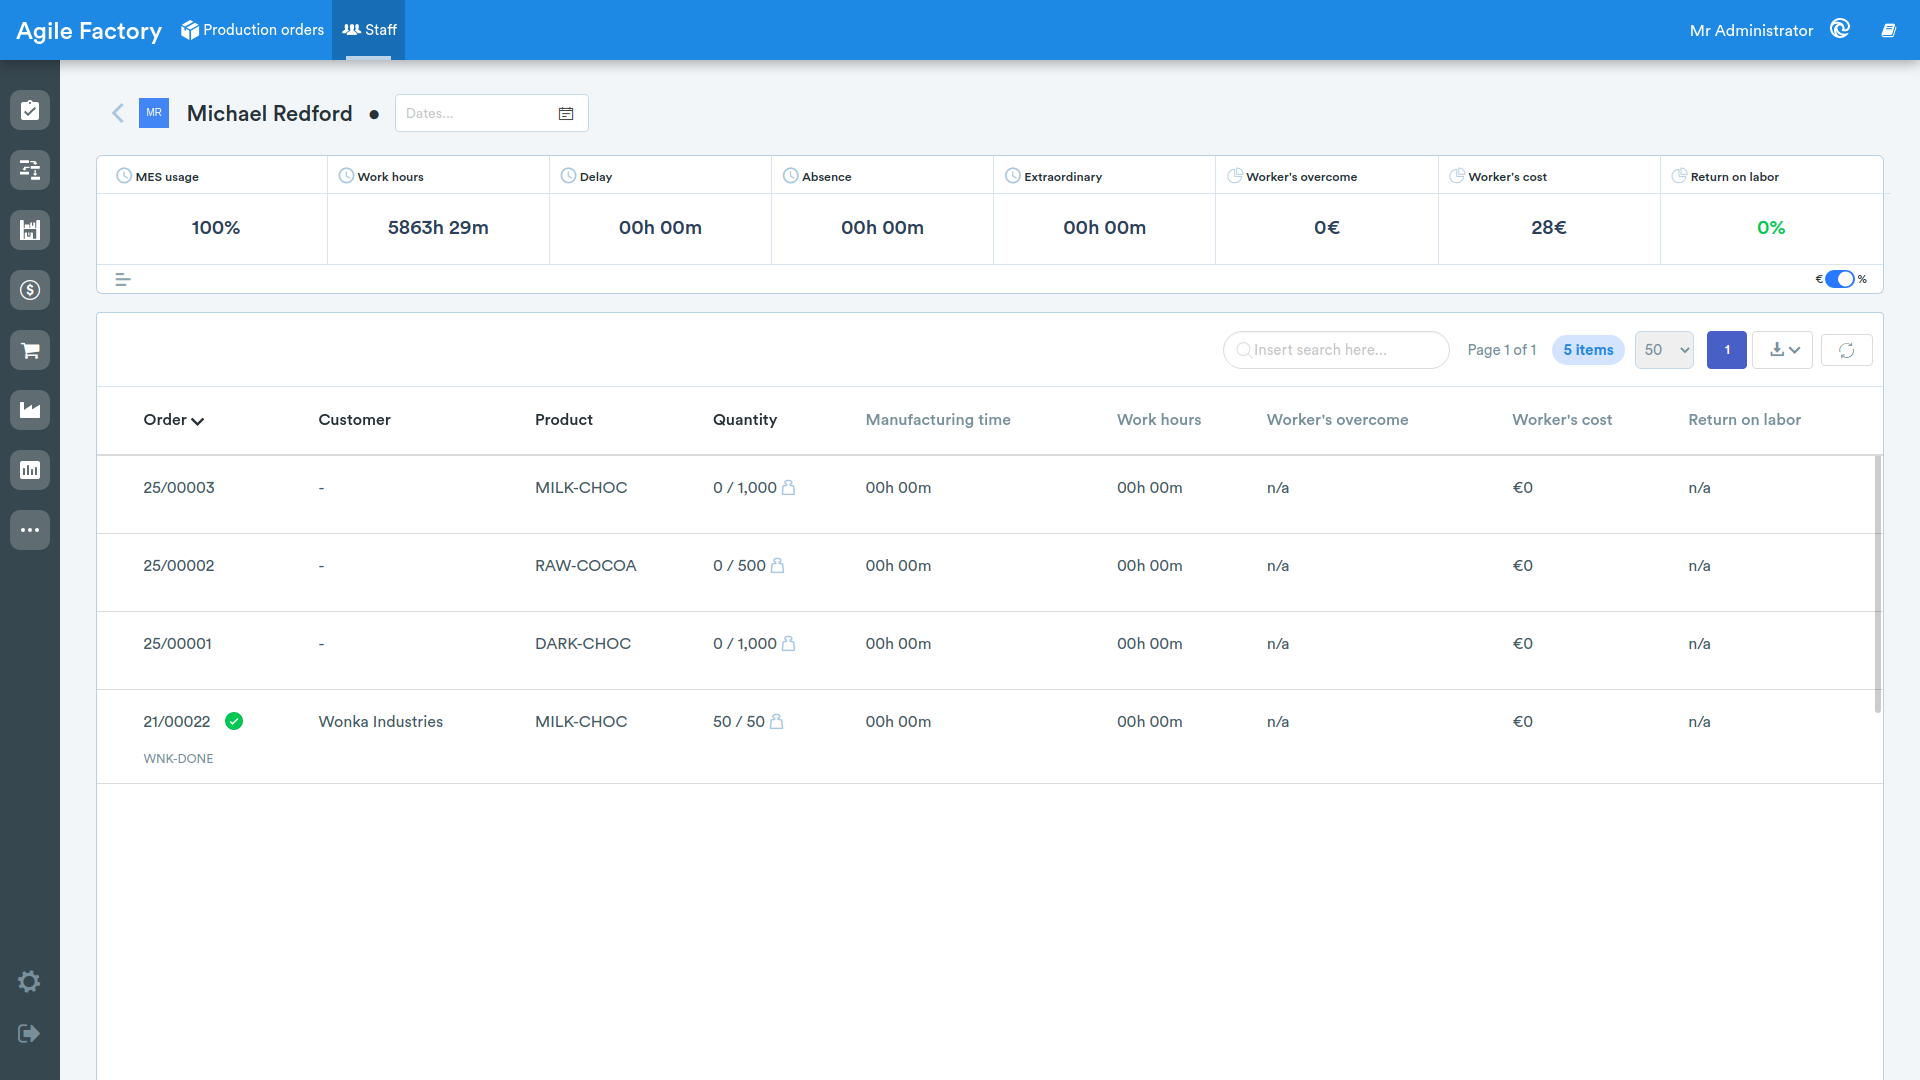
At the bottom of the screen, similar data is reported related to production orders executed by the employee (the date filter is saved from the main menu of the "Personnel" section, but can be changed at the user's discretion).
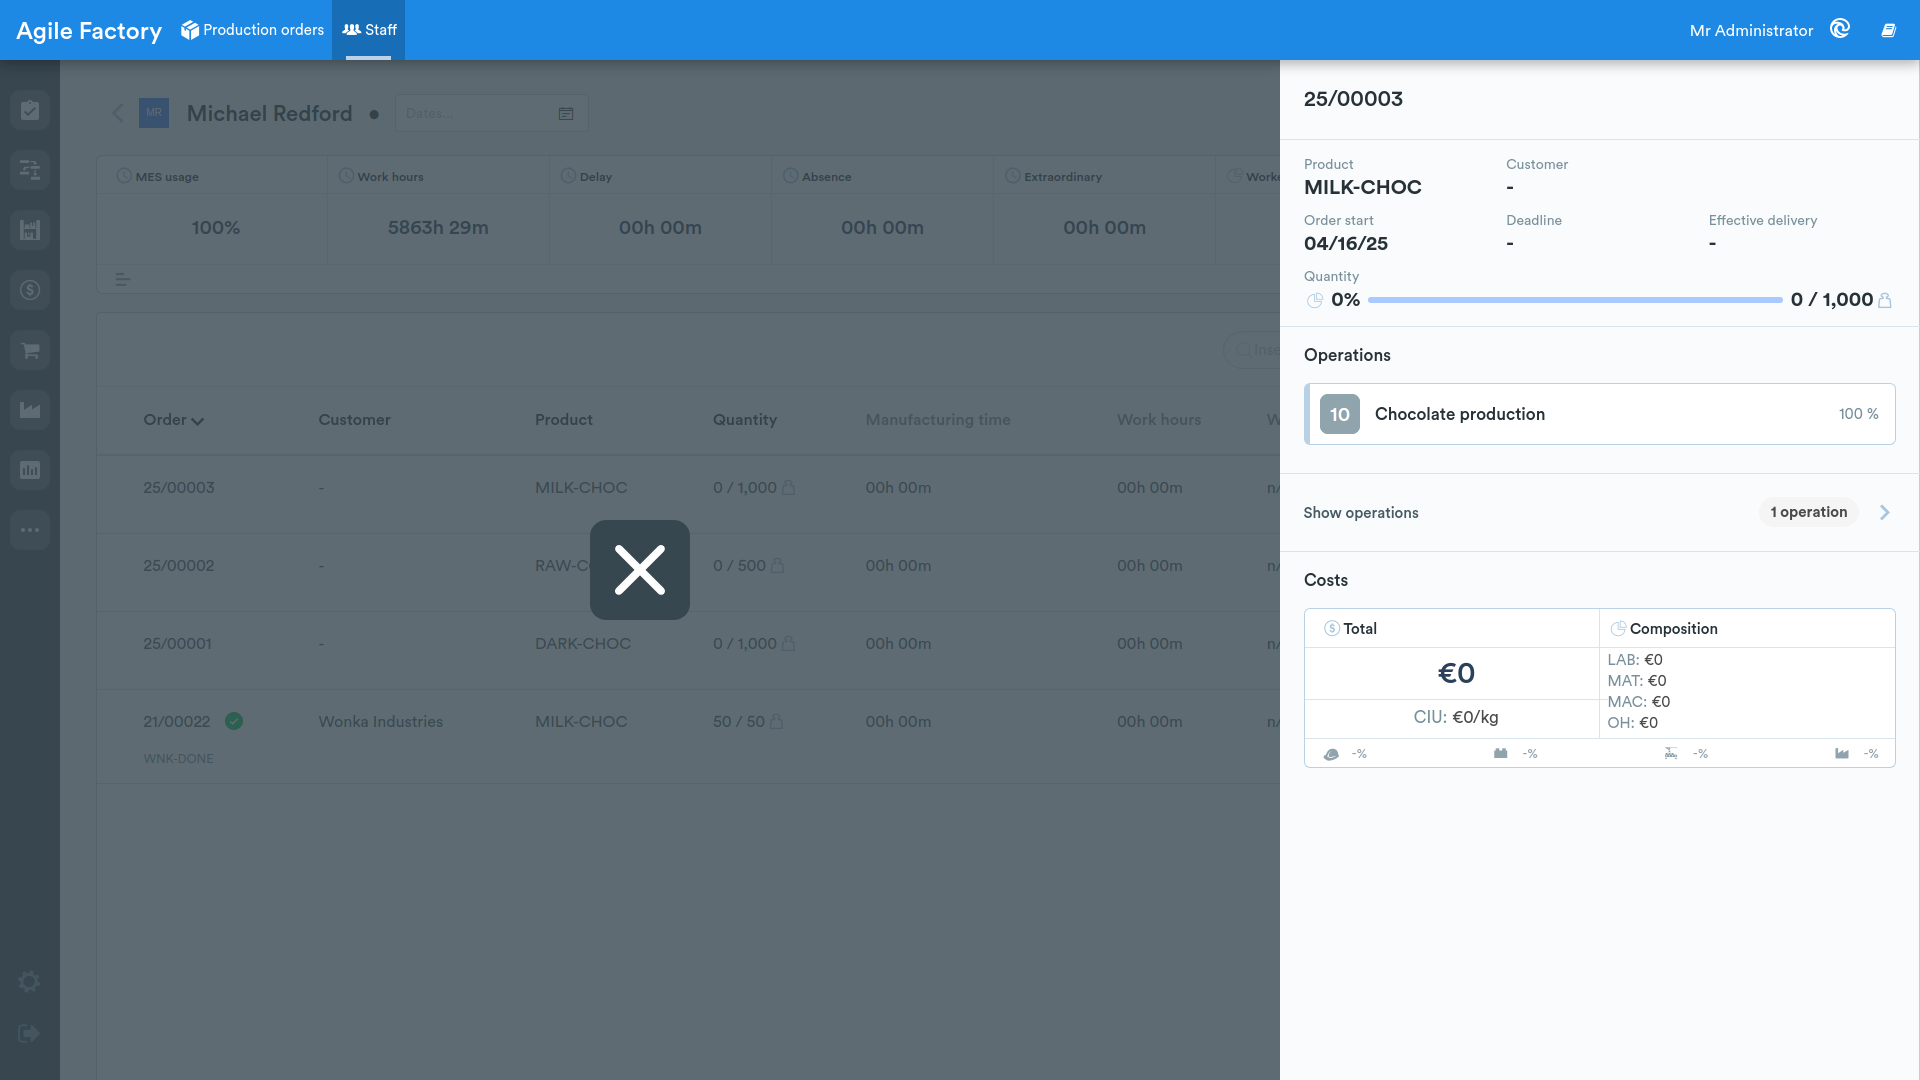
By clicking on one of the orders, it is possible to view the details of the production order execution, as well as each production operation. The information provided is analogous to that available in the "Production Orders" section, but related to the specifically selected worker.
Materials 💻
IN PROGRESS