Dashboard ✨
The Dashboard is a configurable workspace that gathers, in a single grid of panels (widgets), the most relevant indicators and operational views for monitoring the factory. Each dashboard is made up of independent widgets — KPI cards, charts, tables, lists and search modules — arranged on a grid and fed in real time by production data.
Dashboards are organised into groups (for example the default Dashboard MES group) and can be defined per individual user or per user group. The widget composition, the titles and the available filters are configurable: the setup described below refers to the default dashboards shipped with the MES preset.
Navigation
Dashboards belonging to the same group are reached through the tabs in the top navigation bar. Each tab shows the dashboard icon and label, and tabs are displayed in the configured order. The Dashboard MES preset contains the tabs Stato produzione (Production status), Scostamenti (Deviations) and Fermi produzione (Production stops).
The last dashboard viewed is remembered: reopening the module takes you automatically to the last group/dashboard combination used.
Filter bar
When a dashboard defines filters, the filter bar appears below the header, marked by the Filters label. Filters are applied to every widget in the dashboard and the selection is persisted between sessions.
- Period: a dropdown with the time presets Last 7 days, Last 30 days, Last 3 months and This year; the All periods entry removes the time constraint. The default period is Last 30 days.
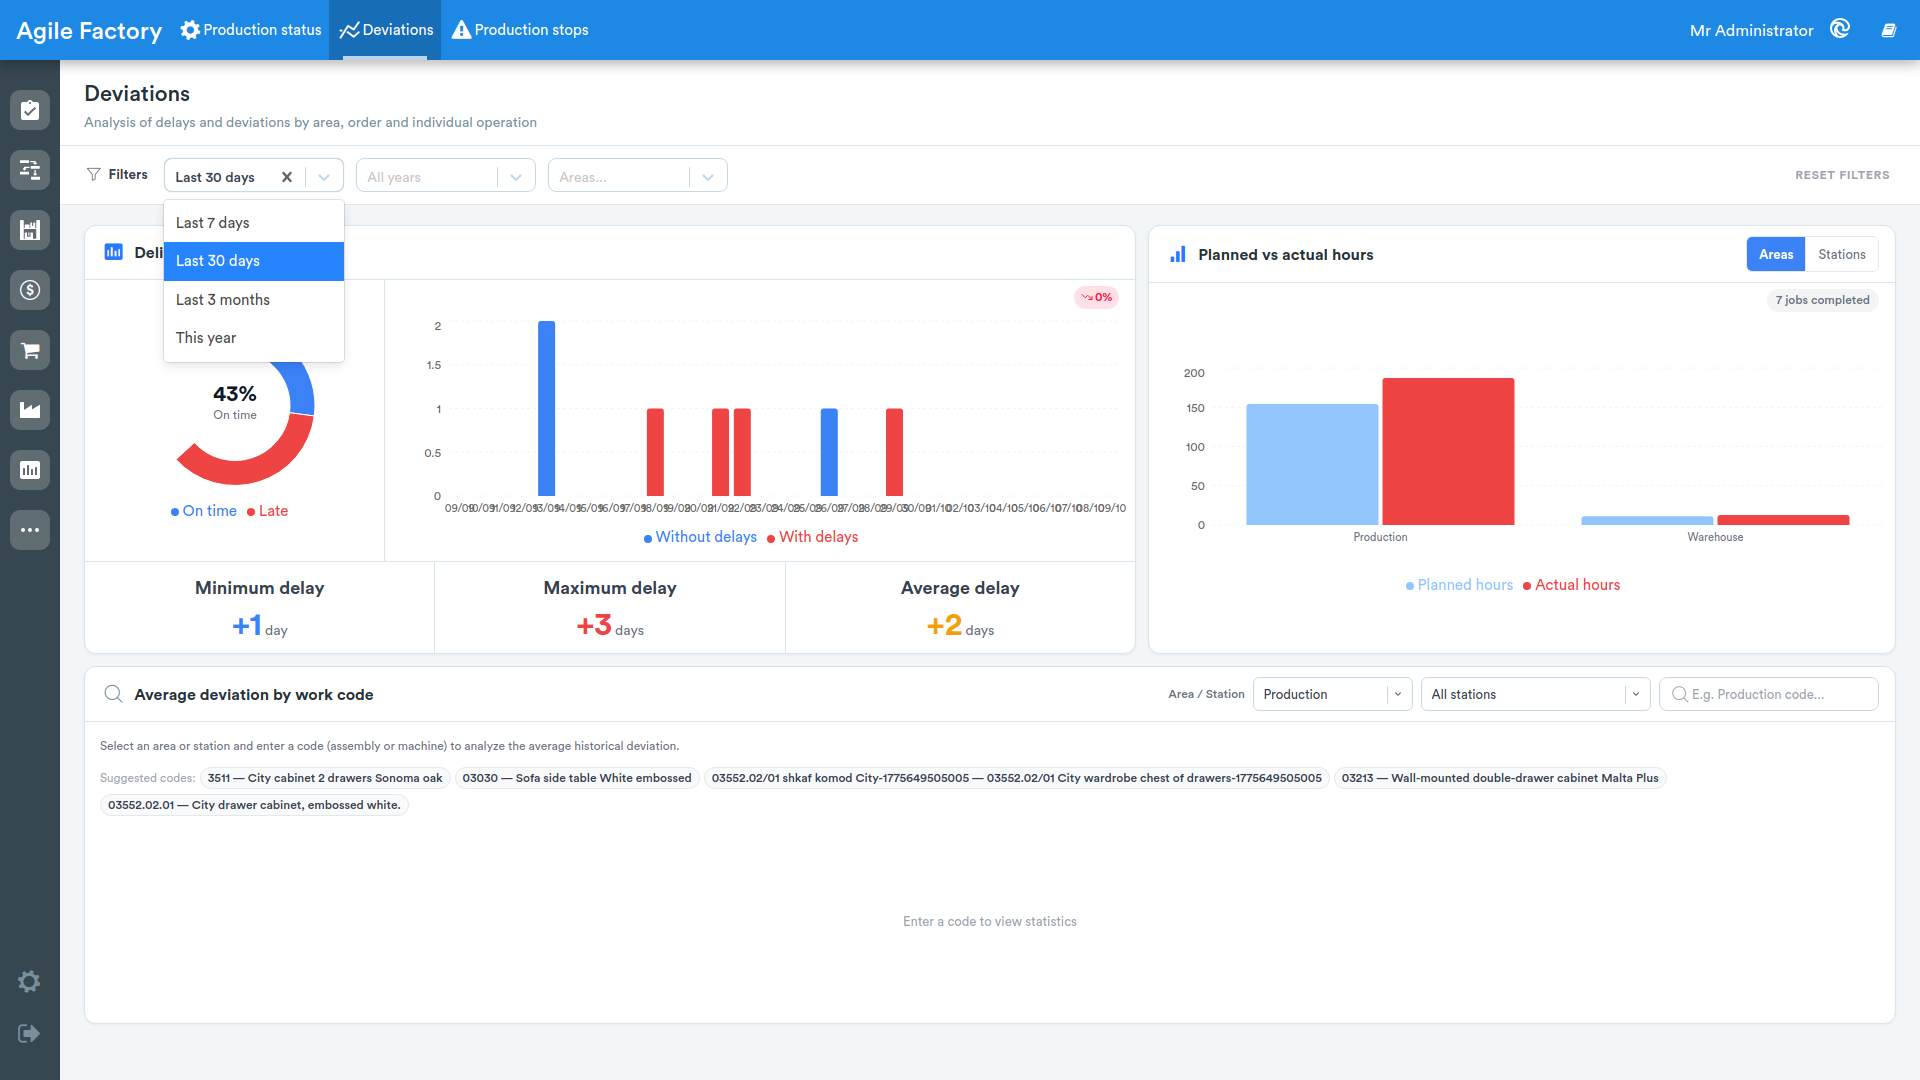
- Year (placeholder All years): selection of a single year. Period and year are mutually exclusive — choosing a year clears the period filter and vice versa.
- Type (placeholder All types): filters by event type; the options are loaded dynamically from the data.
- Area: filters the data by production area/department.
- Severity: filters by severity level, with the matching coloured icon next to each entry.
When at least one filter is active the RESET FILTERS button appears, restoring all filters to their default values.
Available widgets
Widgets are the building blocks of the dashboard. Each widget type is generic and is configured through the dashboard data; the main available types are described below.
KPI card
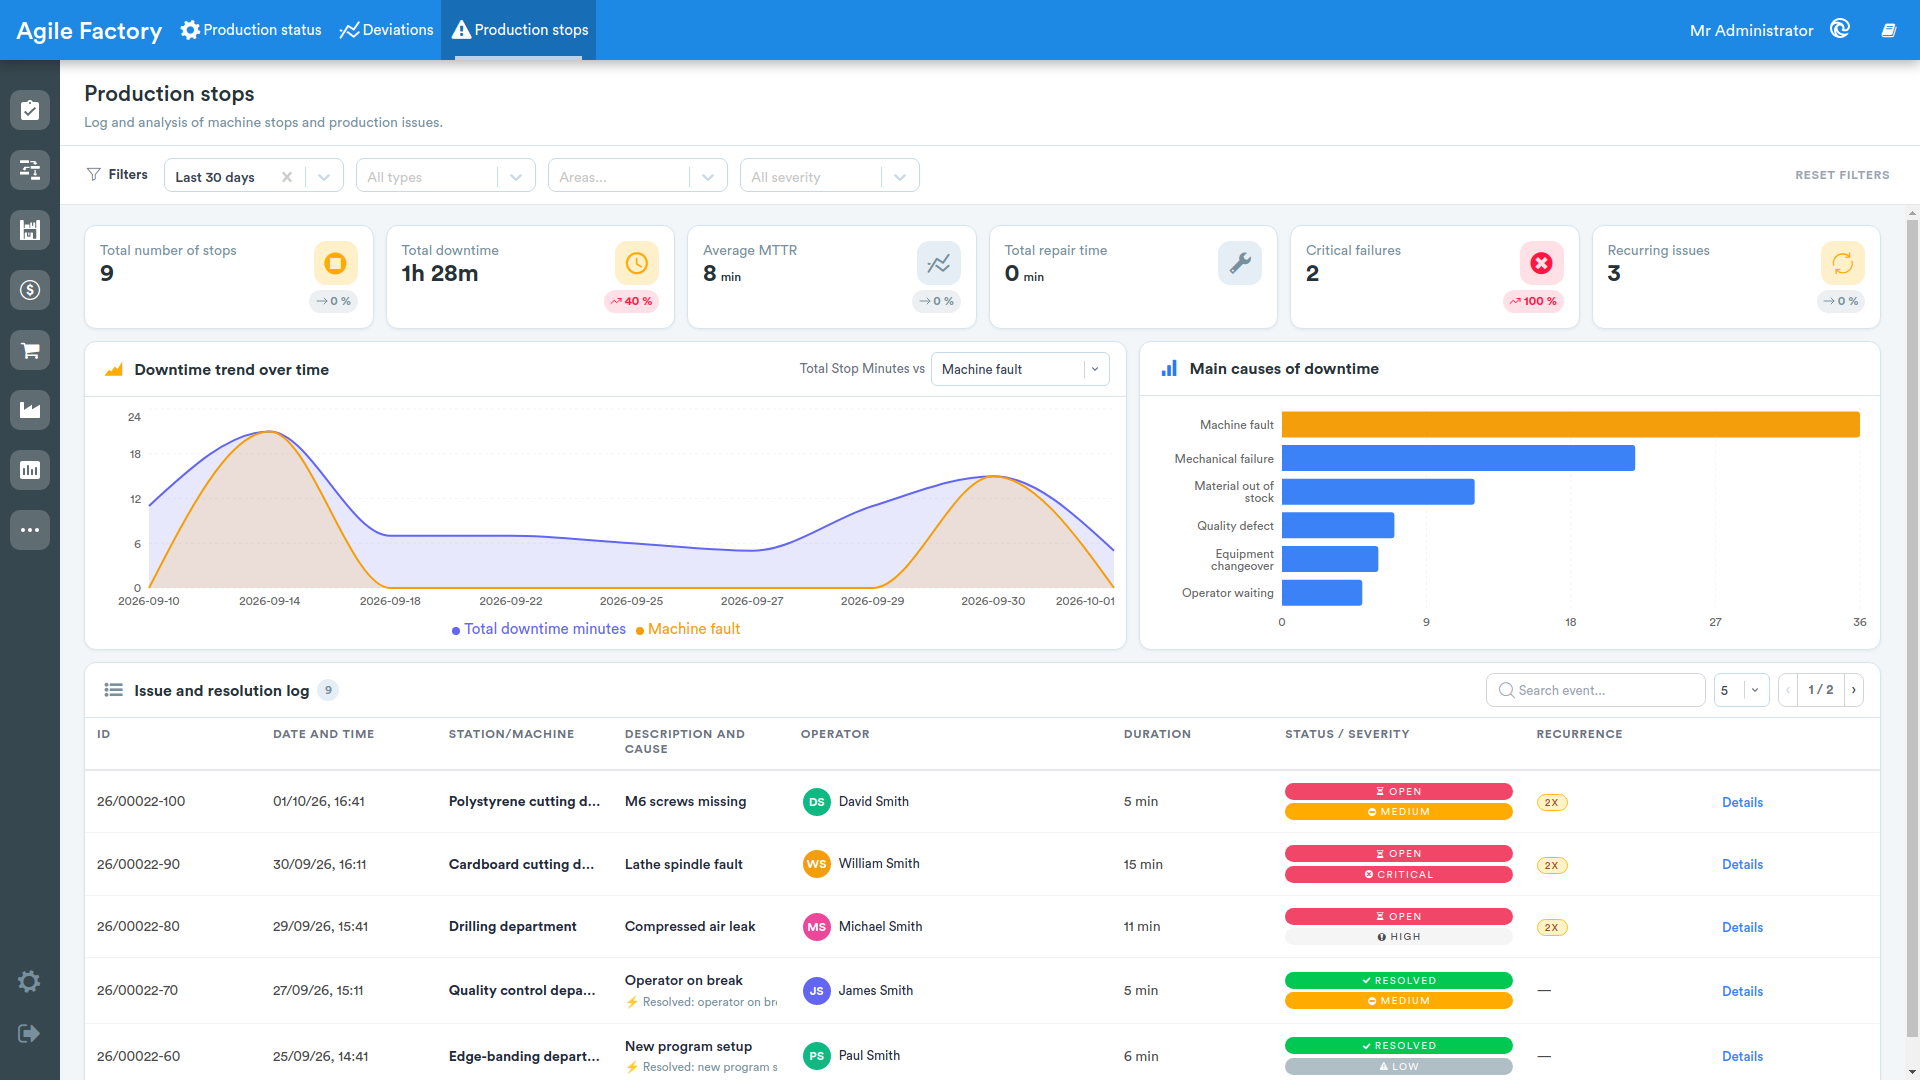
The KPI card shows a single numeric value with its title, an optional unit of measure and a trend indicator (up arrow, down arrow or flat). The indicator is coloured green when the trend is favourable and red when it is unfavourable.
Chart
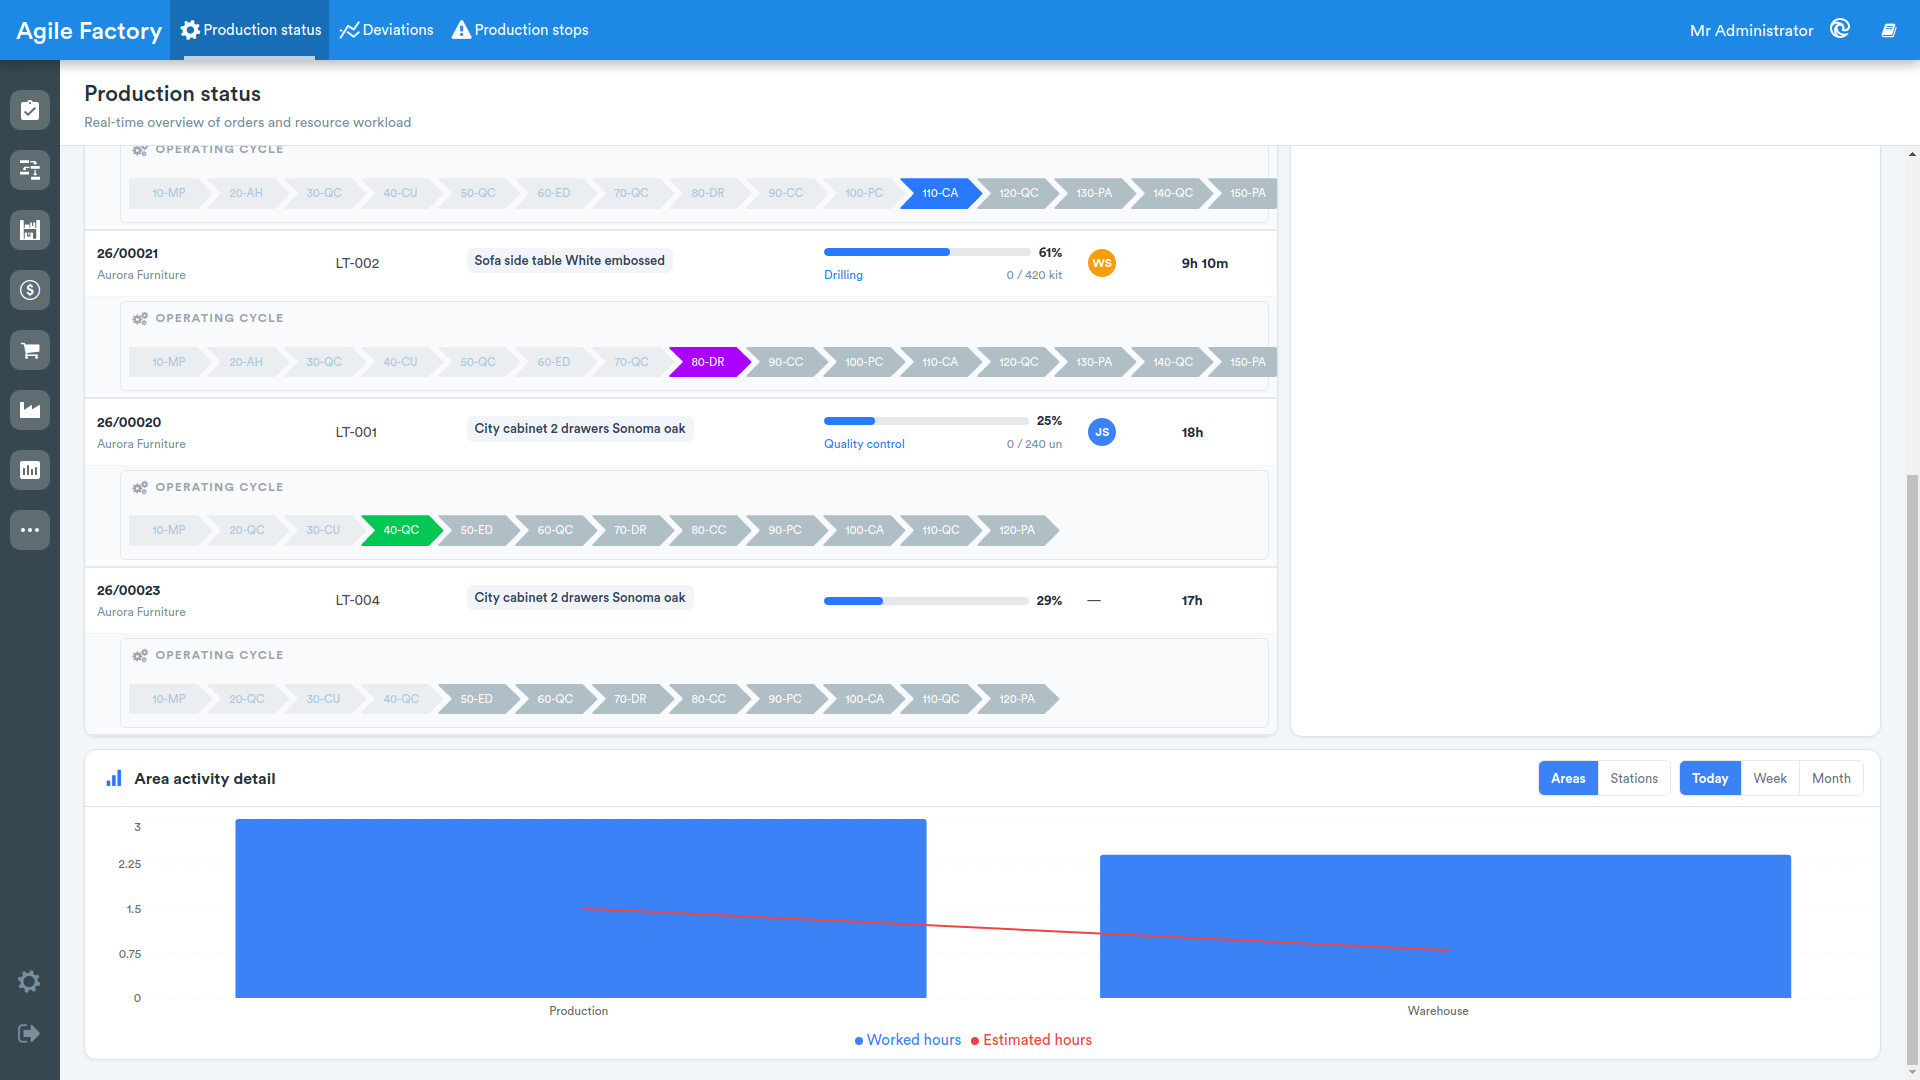
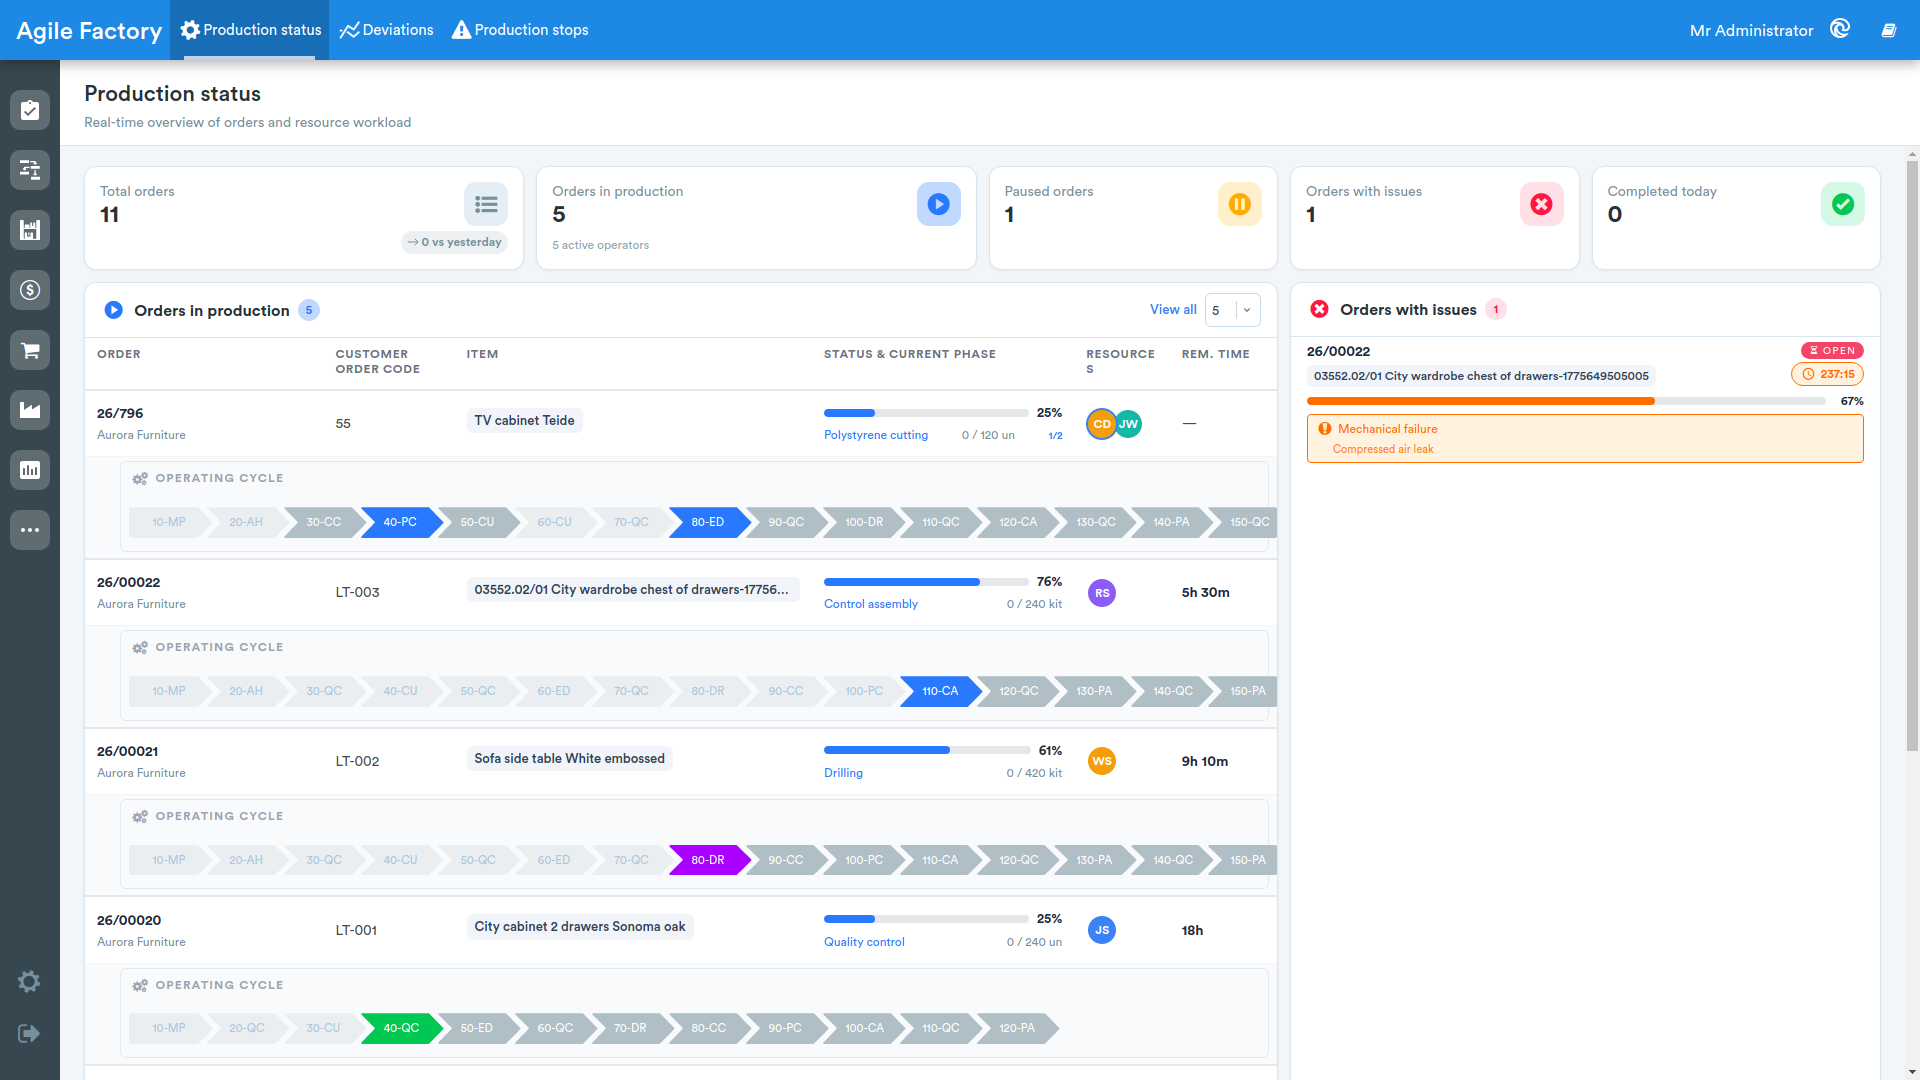
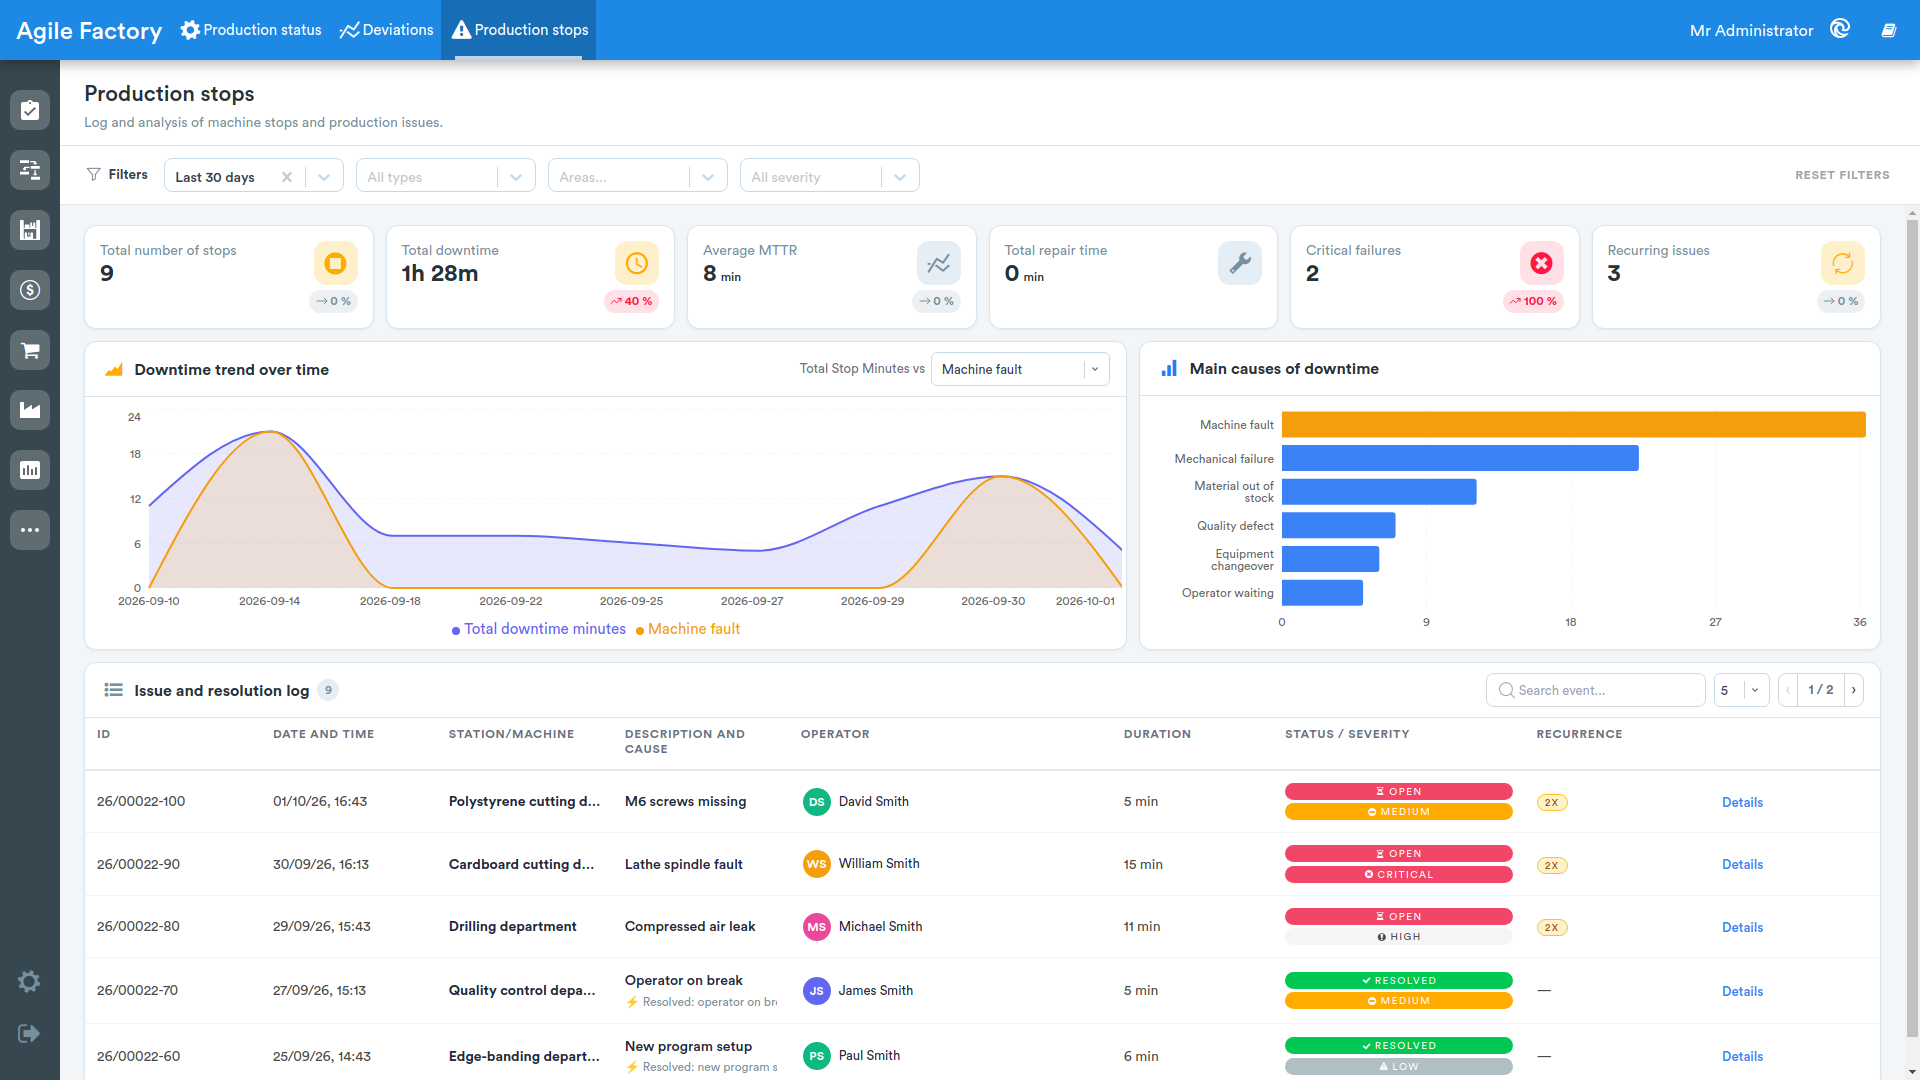
The chart widget displays data series in several shapes (bar, stacked bar, horizontal bar, line, area, bar + line combination, donut chart). Depending on the configuration, the chart header may show:
- a toggle for the view mode (for example by area or by station);
- an area selector — with the Select area… entry — shown when the view is by station;
- a comparison selector marked by the Total Stop Minutes vs label;
- a toggle for the aggregation period.
When no data is available the No data available message is shown; in station mode, until an area is selected, the prompt Select an area to view stations is displayed. If the chart exposes the count of completed jobs, it is shown as a badge (for example "12 jobs completed").
Table
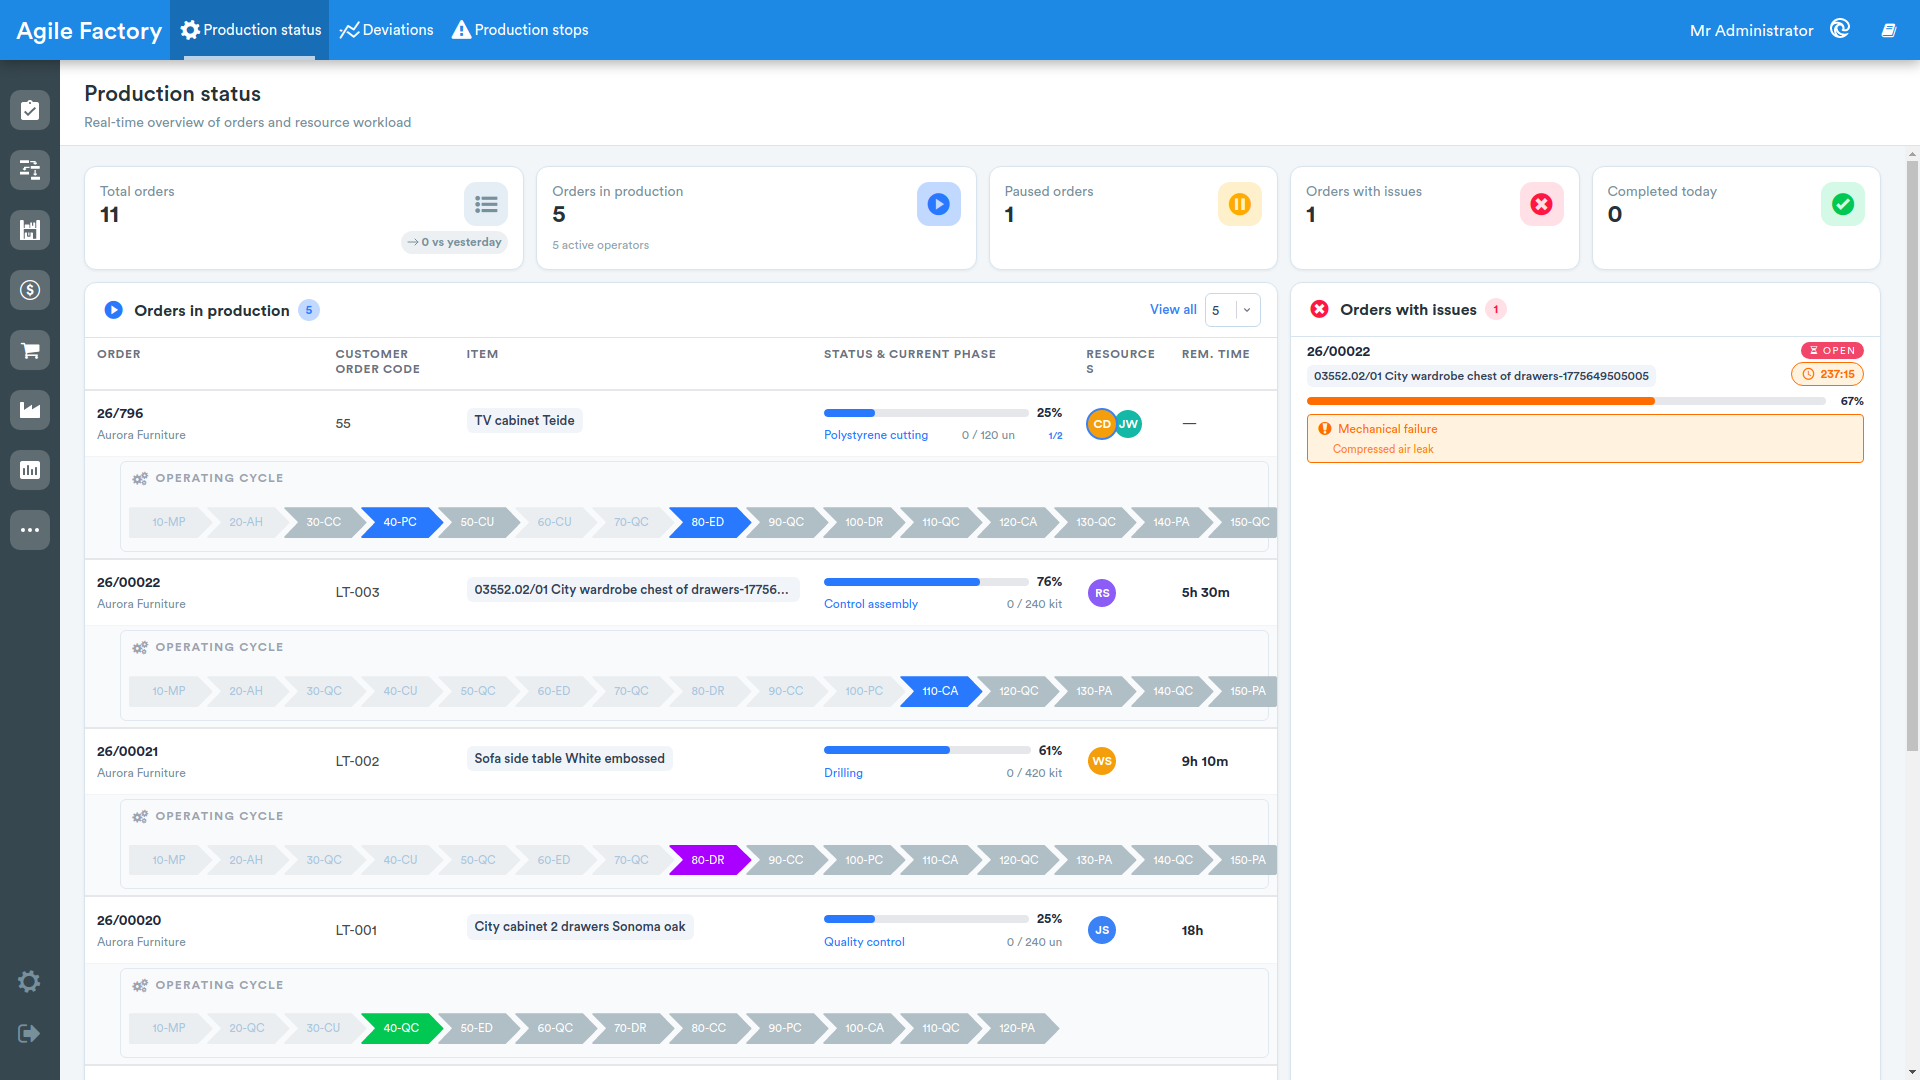
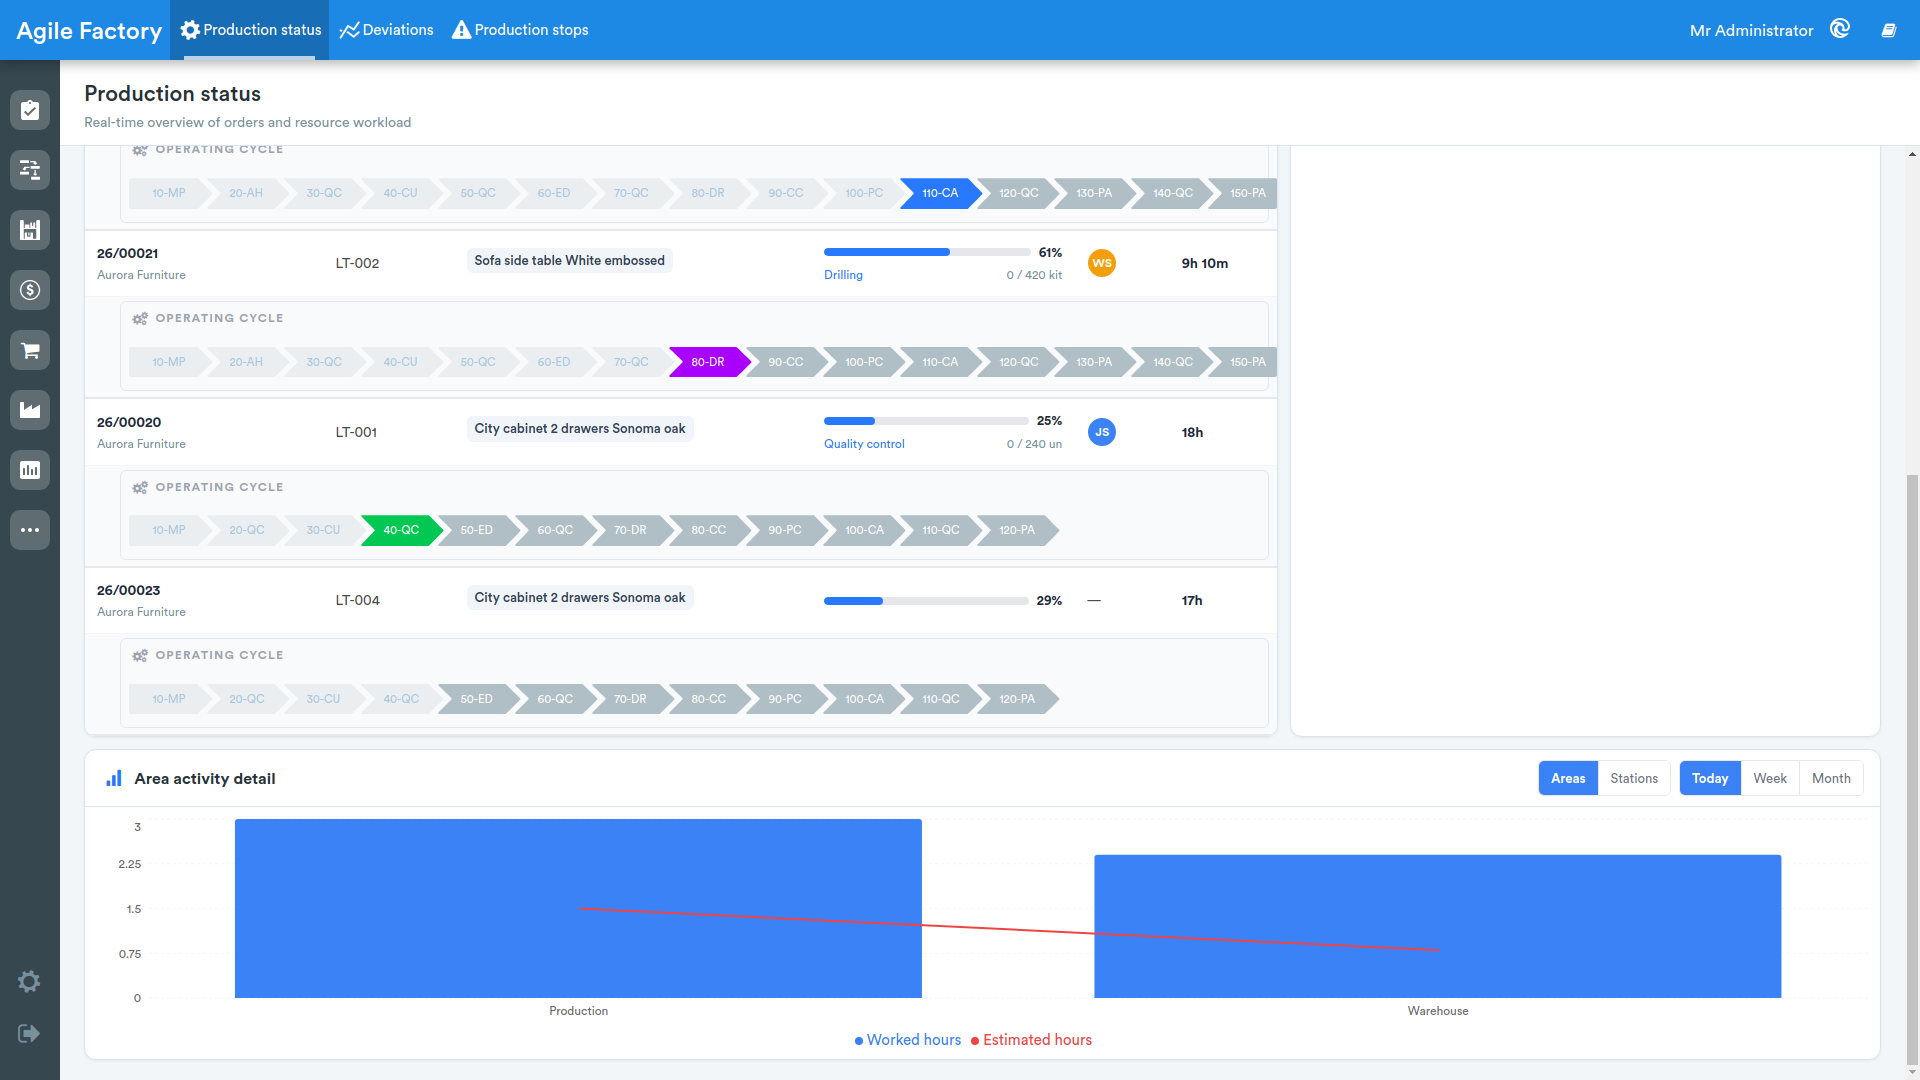
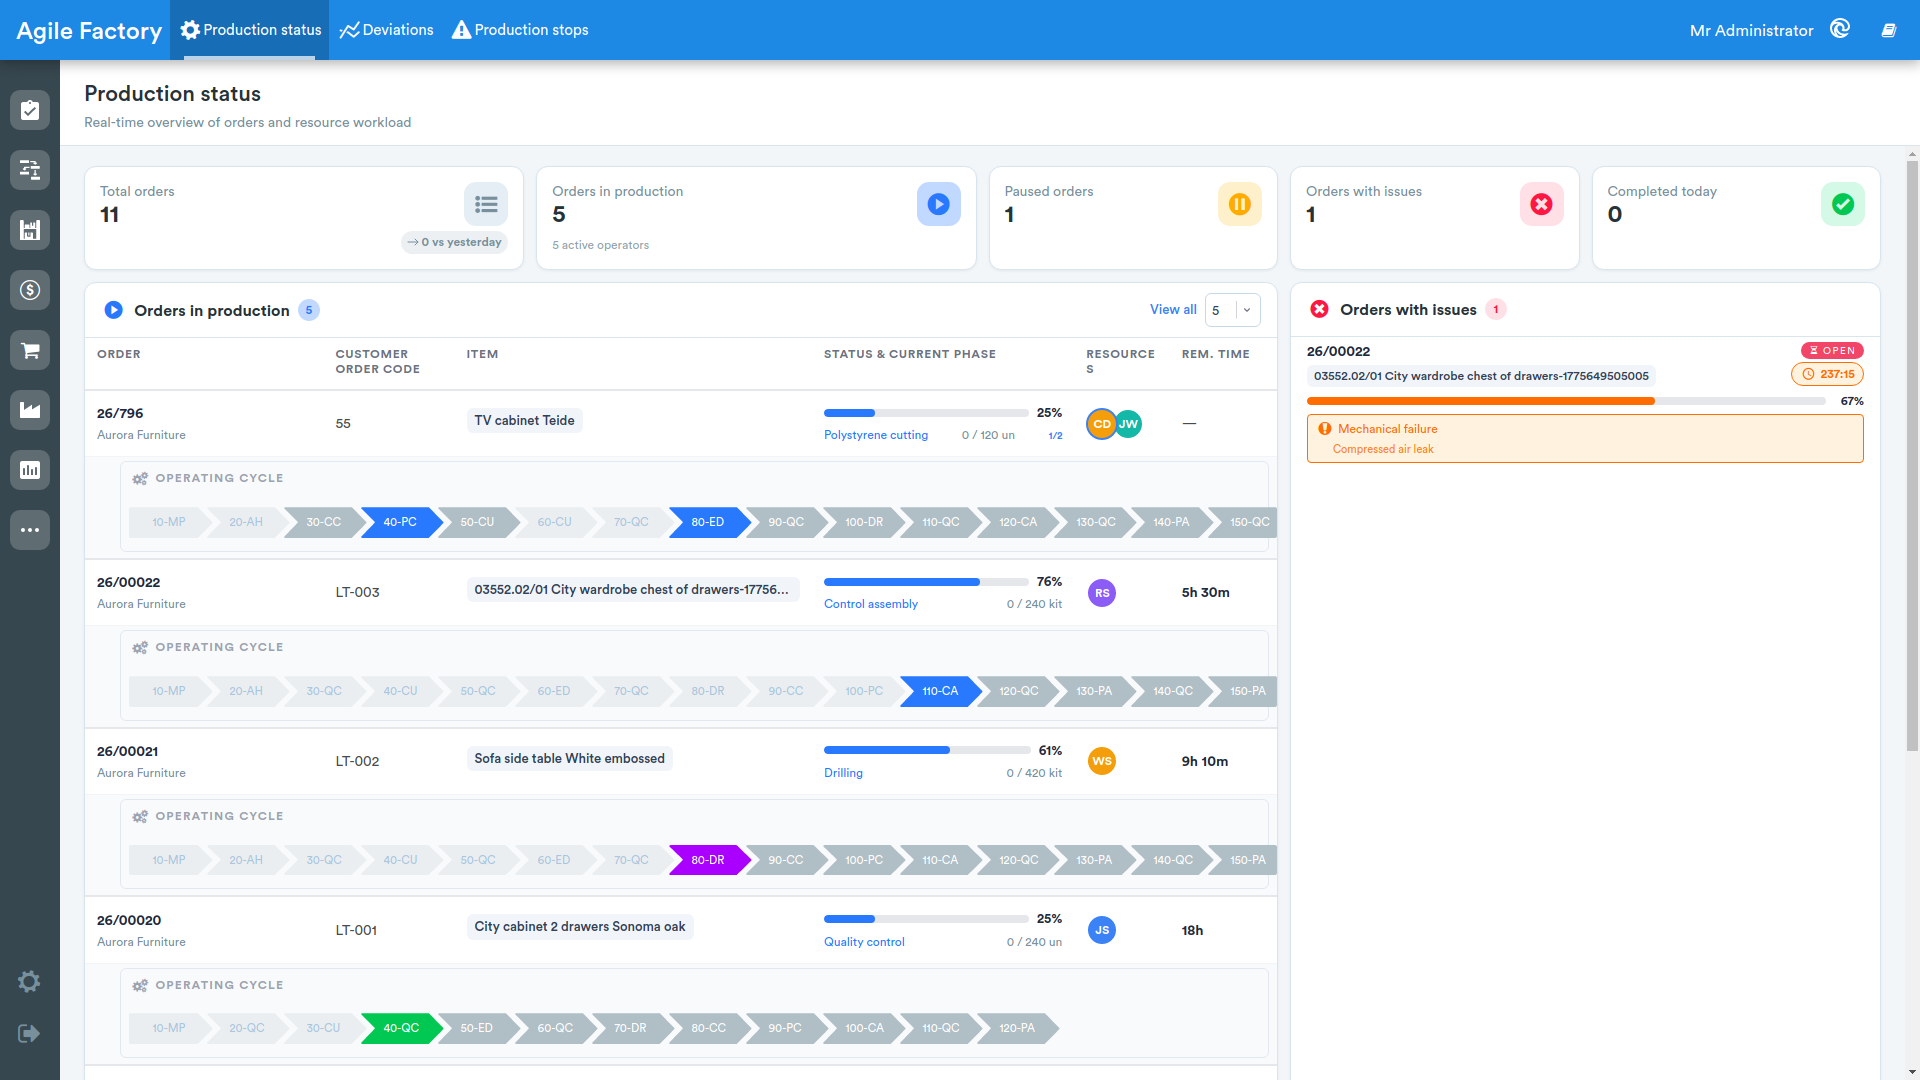
The table widget presents data in tabular form with configurable column headers, for example Order, Item, Customer Order Code, Status & Current Phase, Rem. Time and Resources.
- Rows that contain child orders can be expanded (Expand / Collapse) to show the Child Orders section and the Operating Cycle of the operations.
- The search box (placeholder Search event...) filters rows by free text.
- The footer shows the count with the wording Showing N of M and the pagination controls Previous / Next.
- Selecting a row, where enabled, opens the item detail panel (drill-down feature).
When there is no data the No data message is shown.
Entity list
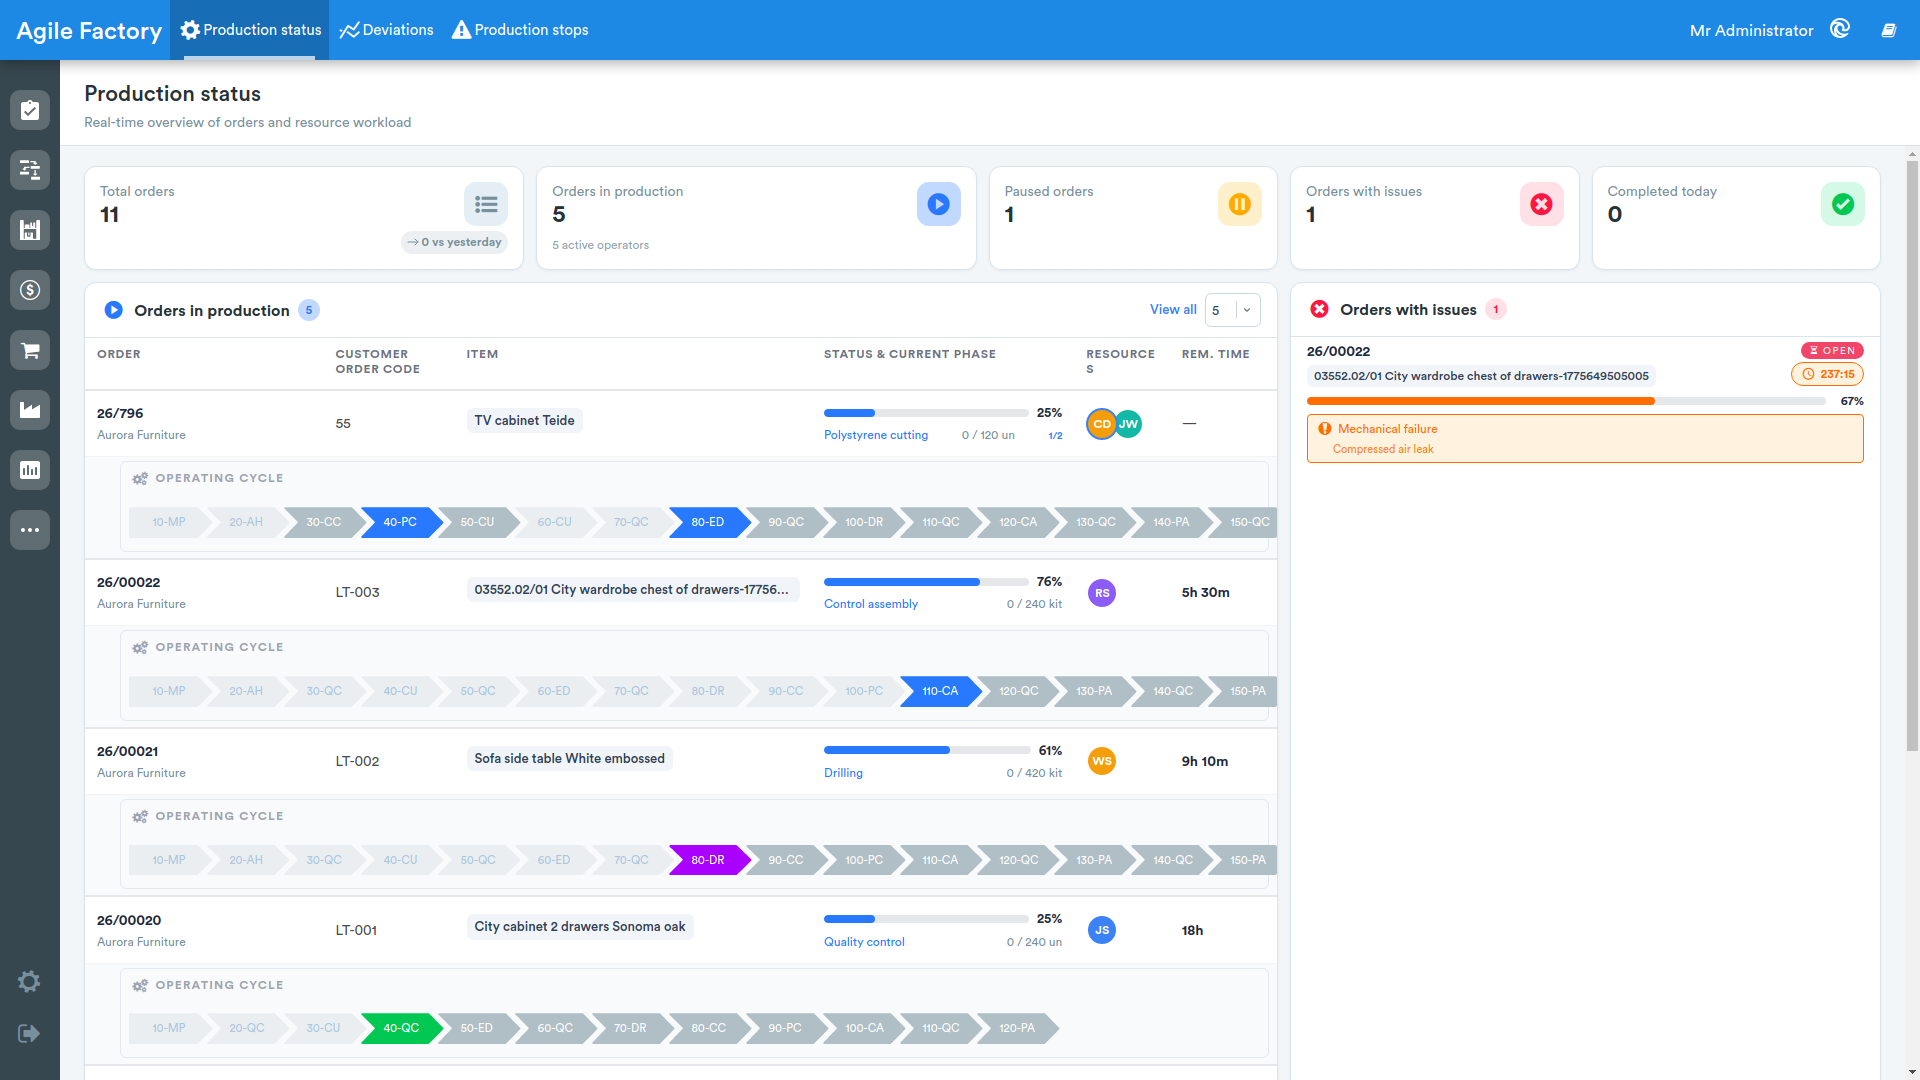
The entity list shows a series of compact cards, each with a title, an optional subtitle, a progress bar and a badge (for example a timer measuring the elapsed time). Cards may show an alert with the icon and colour matching the severity level. The list can refresh automatically in real time.
Search module
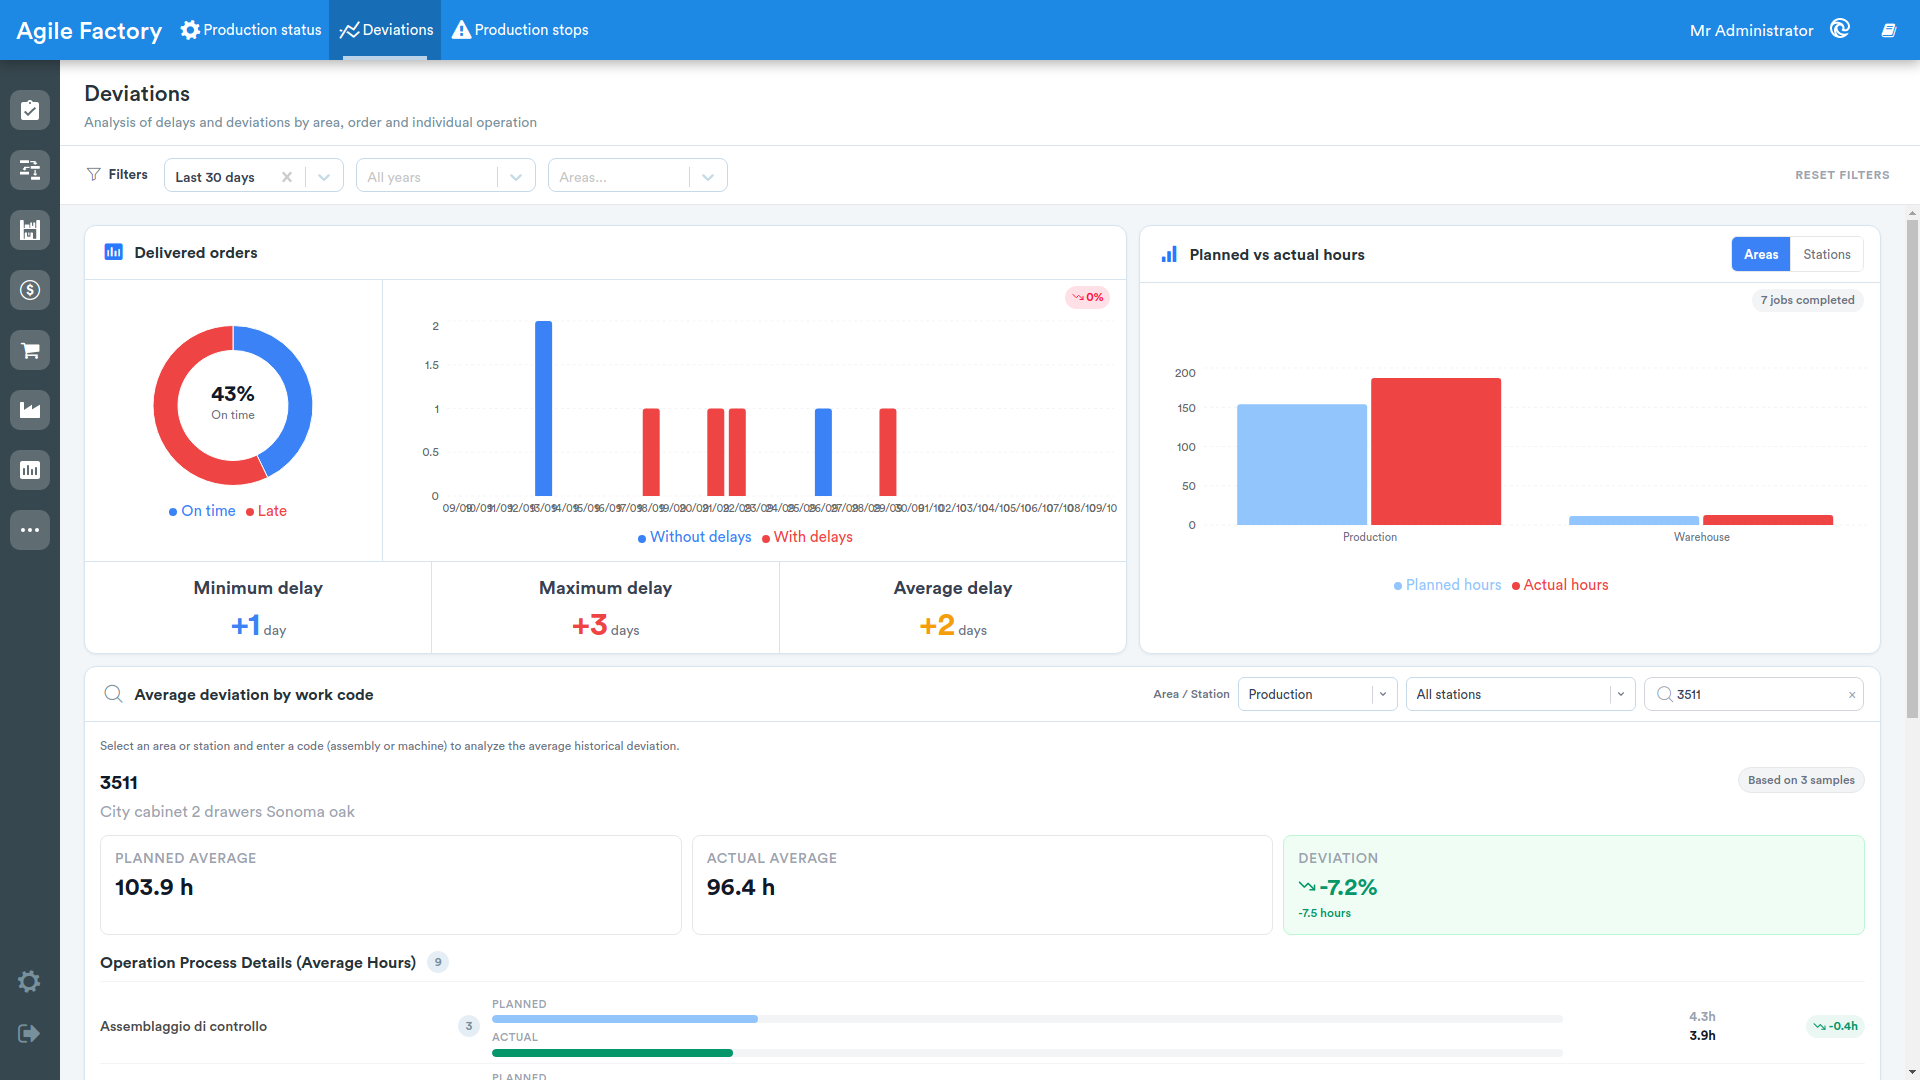
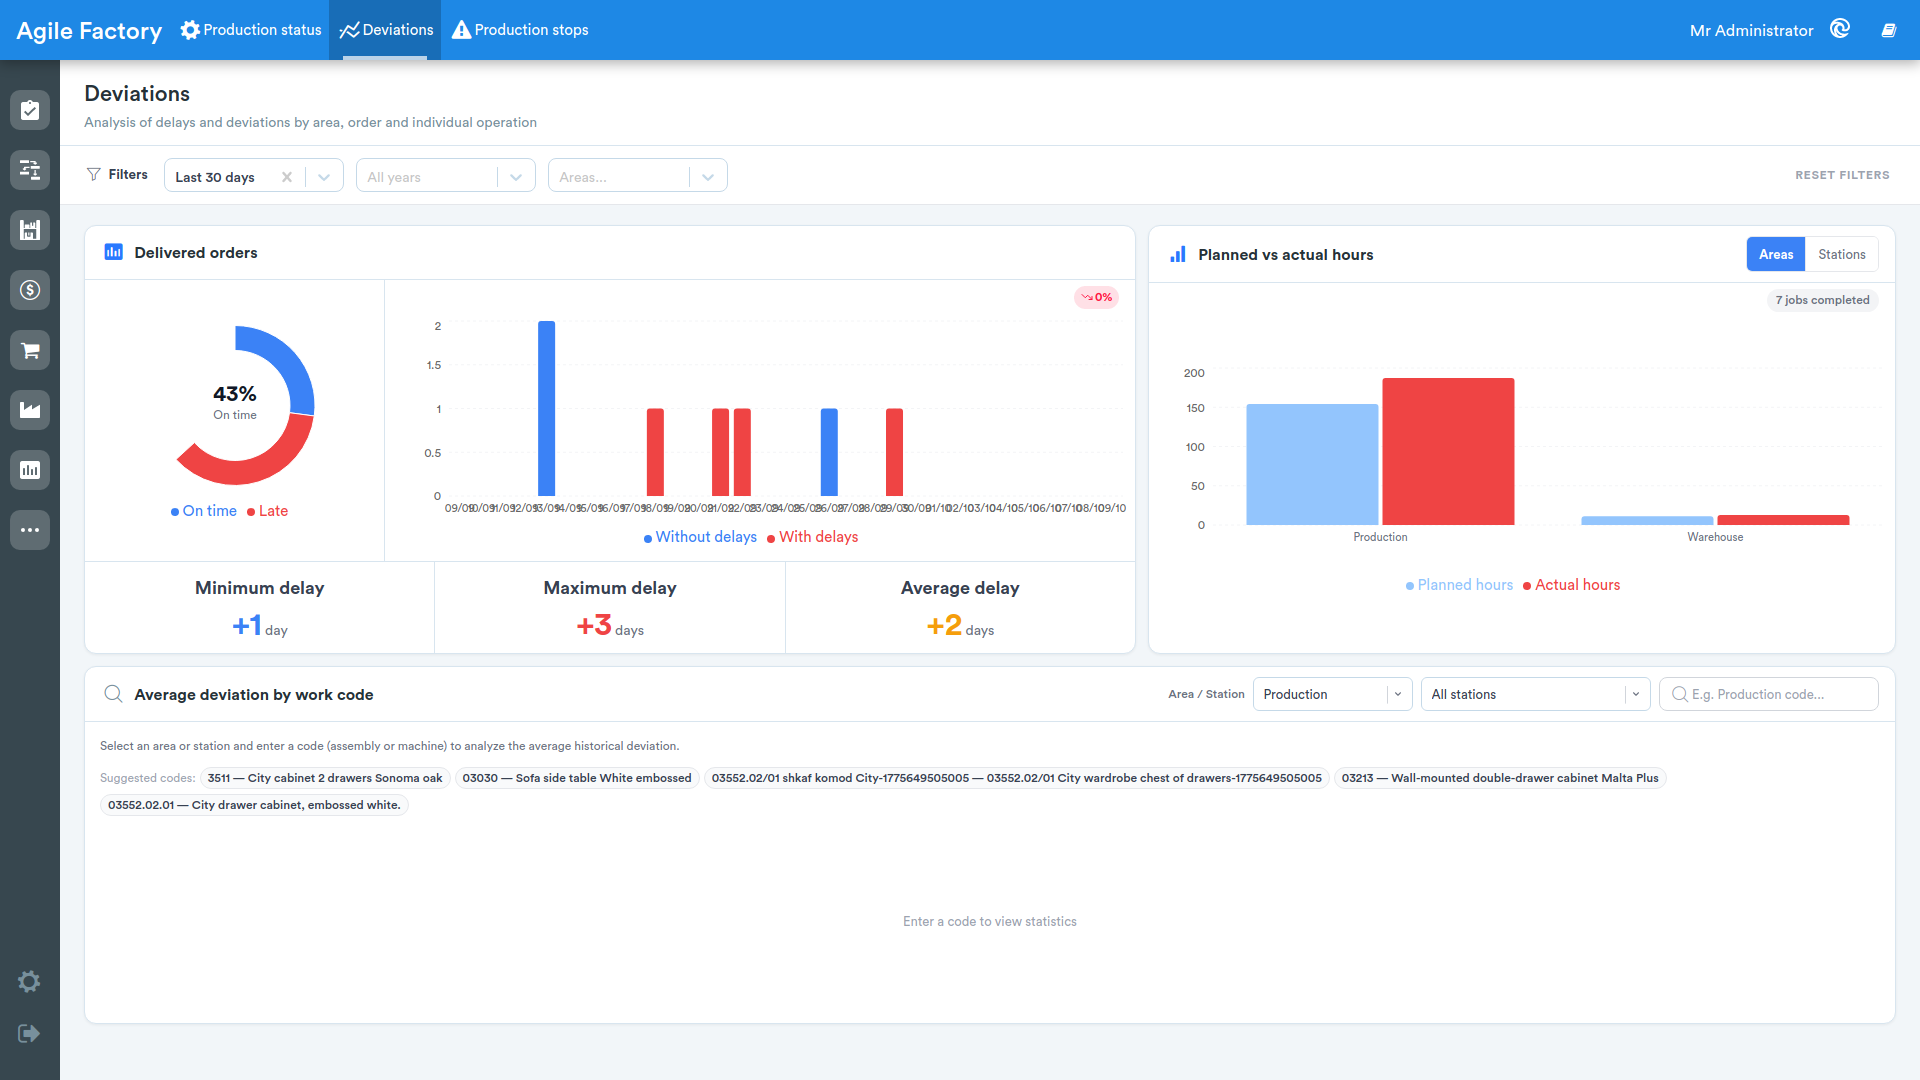
The search module lets you analyse the statistics of a single item (for example a work code). Until a code is entered the Enter a code to view statistics message is shown.
- The header provides the area and station selectors (All stations entry) and the code search box (placeholder E.g. code...).
- While typing, suggestions appear under the Suggested codes: or Results: labels.
- Selecting a code shows the result card with the KPI indicators and the Based on N samples badge.
- The Operation Process Details (Average Hours) section compares, for each operation, the PLANNED and ACTUAL values with their deviation.
Compound widget
The compound widget combines several primitive widgets into a single card, arranging them in a sub-grid with optional separating borders and spacing. It is used, for example, to place a summary card next to a chart within the same panel.
Default dashboards
The Dashboard MES preset ships with three ready-to-use dashboards.
Production status
A real-time overview of orders and resource load. It has no filters and refreshes automatically. It contains a strip of KPI cards (for example total orders, orders in production, paused orders, orders with issues, completed today), the table of orders in production, the list of orders with issues and the chart detailing area activity.
Deviations
Analysis of delays and of the deviations between planned and actual hours, by area, order and single operation. It provides the Period, Year and Area filters. It contains a compound widget on delivered orders, the chart comparing planned and actual hours, and the search module for the average deviation by work code.
Production stops
Register and analysis of machine stops and production issues. It provides the Period, Type, Area and Severity filters and refreshes in real time when new events occur. It contains the stop KPI cards (total number of stops, total stop time, average MTTR, total repair time, critical failures, recurring issues), the charts on the stop trend and on the main stop causes, and the problems and solutions register table.
Stop event detail panel
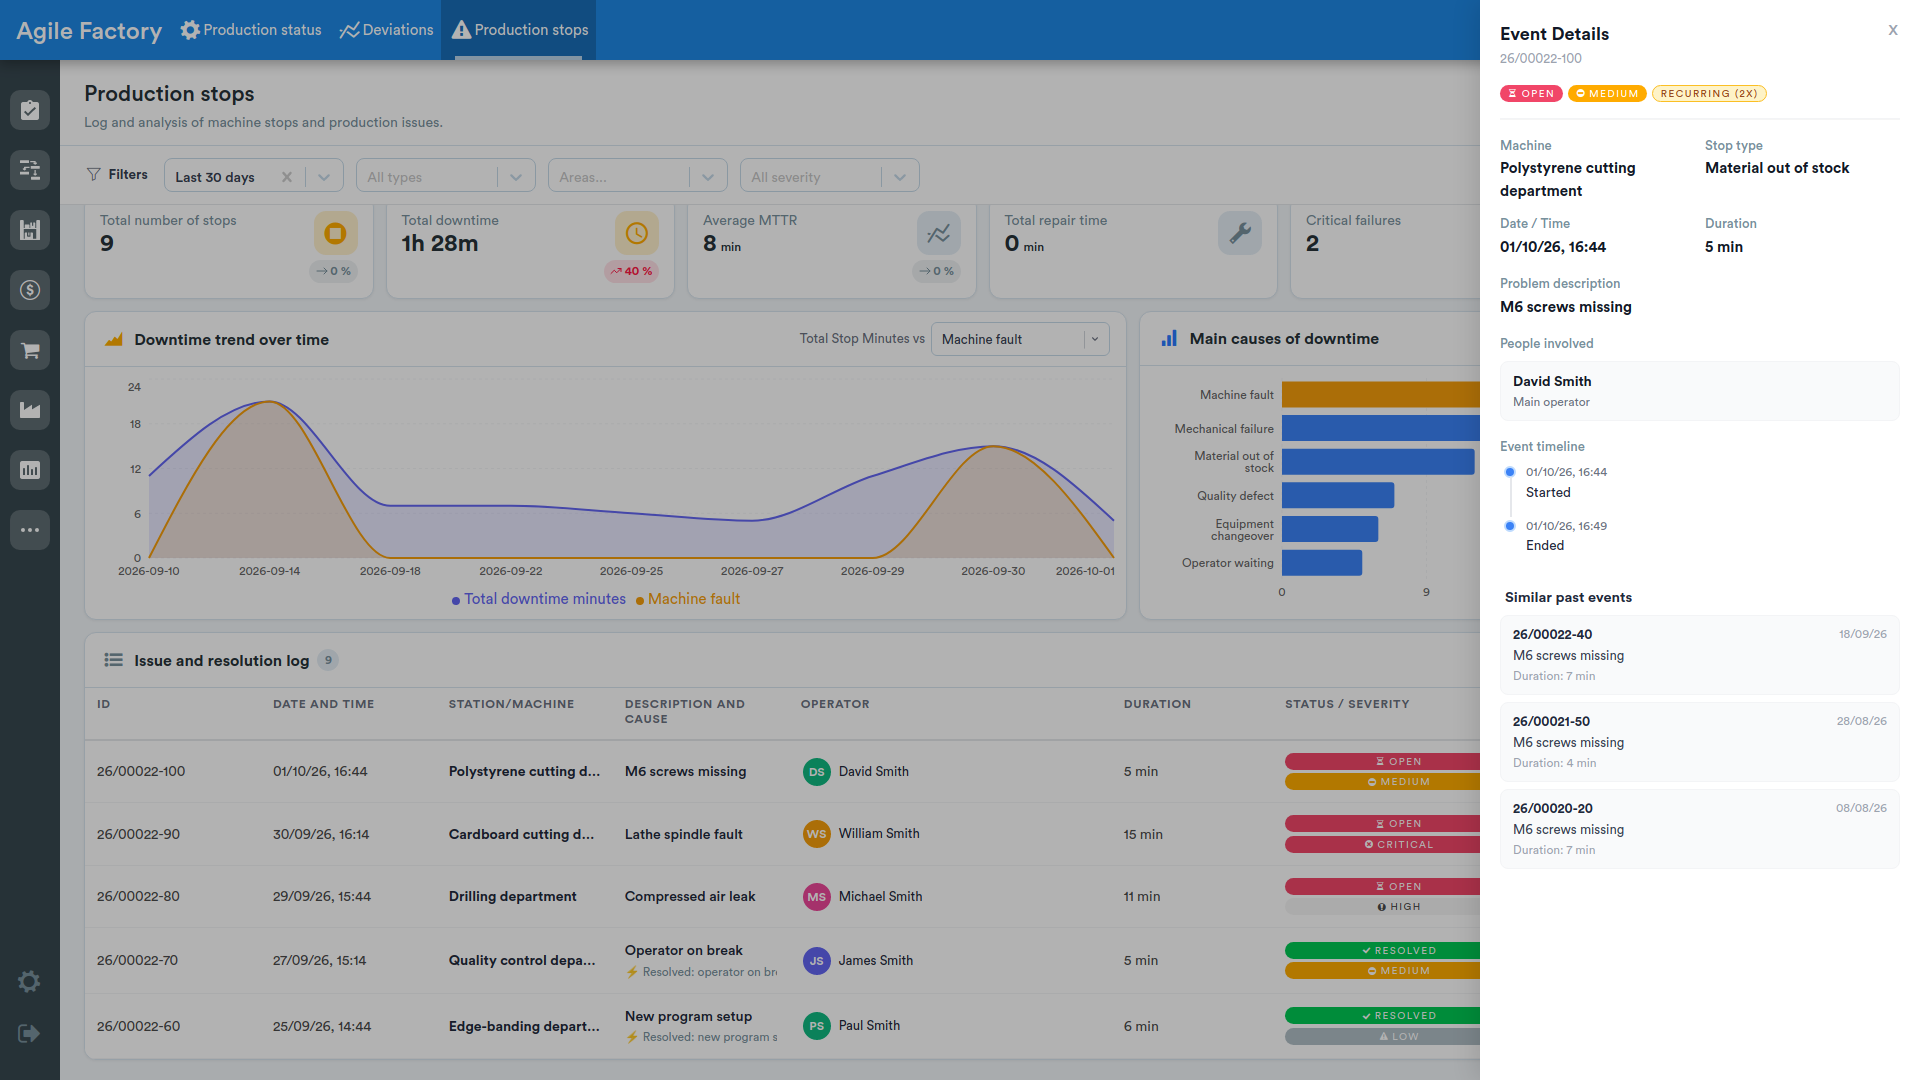
From the stop register table you can open the Event Details panel, which shows the complete information of a single stop. The panel reports the event status and severity and an information grid with the fields Machine, Stop type, Date / Time and Duration (when the stop is still open, the duration is shown as an active timer).
Further down the panel may contain:
- the Problem description and the Manager notes;
- the People involved section, with the operator marked as Main operator;
- the Repair job section, with the fields Job code, Status, Technician and Duration;
- the Event timeline;
- the Similar past events.
The Close button closes the panel.